How Pro Investors Use Chart Trendlines to Make Better Trades
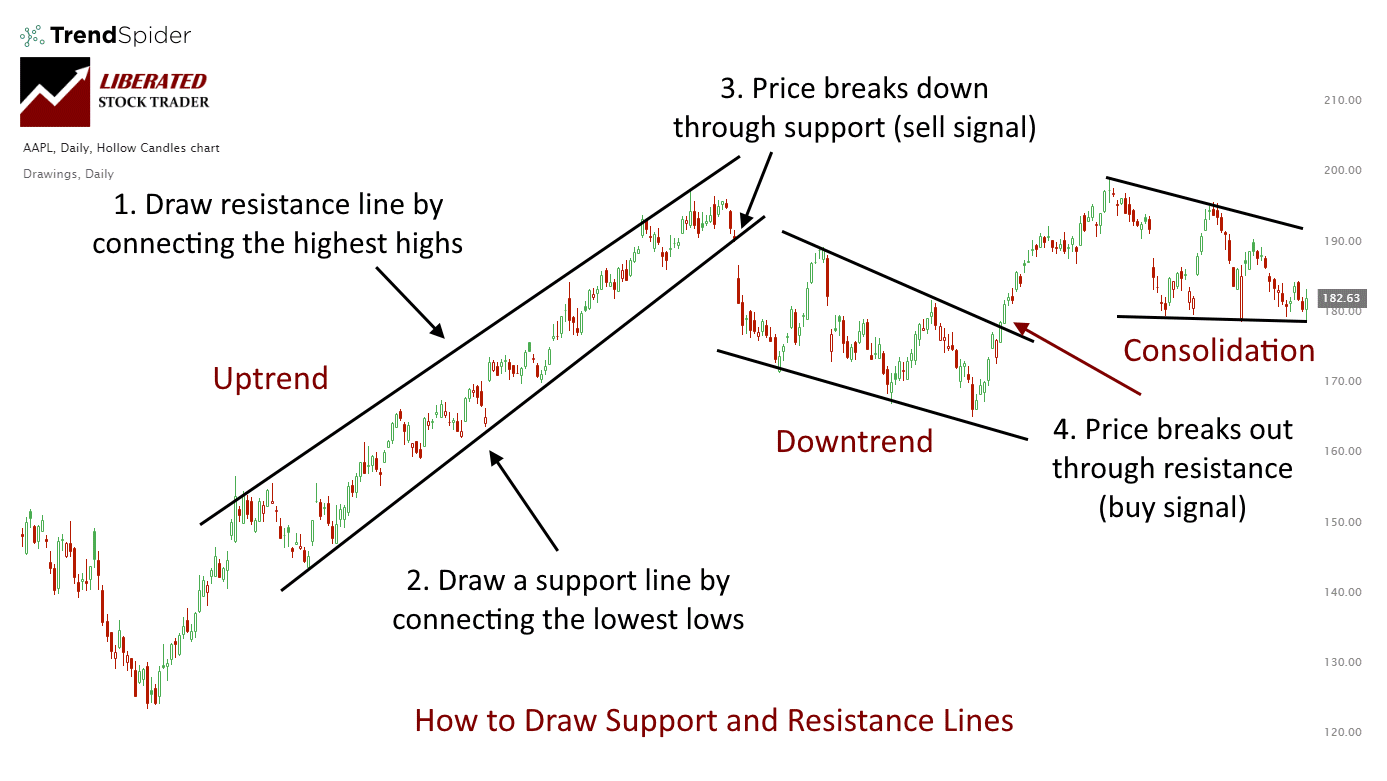
Trendlines are a visual representation of the trend direction in the stock market. They are formed by connecting two or more significant highs or lows on a stock chart, creating a diagonal line that indicates the general trend of the asset’s price movement.
Copy and paste this URL into your WordPress site to embed
Copy and paste this code into your site to embed