Drawing trendlines on stock charts is a powerful way to assess the market’s direction. They help you understand the trend direction and timeframe to set expectations for future market moves, helping you improve your trading.
Do you know if the market is in an uptrend, a downtrend, or a consolidation?
Trendlines are a visual representation of the trend direction in the stock market. They are formed by connecting two or more significant highs or lows on a stock chart, creating a diagonal line that indicates the general trend of the asset’s price movement.
Trendlines matter because buying stocks in an uptrend can be profitable, but in a downtrend, it may not. Learn the simple and effective ways to determine if the market is heading up or down.
Why Draw Trendlines on Stock Charts?
Drawing trendlines on stock charts is one of the most fundamental technical analysis skills that every trader should know. Trendlines help identify support and resistance levels as well as possible entry points. Trendlines enable you to visualize the direction of the stock. Additionally, stock prices breaking through trendlines can provide valuable buy or sell signals.
What is a Stock Price Trend?
A stock price trend is the direction of a stock’s movement over time. Upward trends indicate that the stock price is increasing, and downward trends, or downtrends, indicate that the stock price is decreasing. It’s important to identify whether a stock is trending.
There are three types of trends: uptrend, downtrend, and consolidation. Multiple timeframes must also be considered.
A Simple Rule for Drawing TrendLines
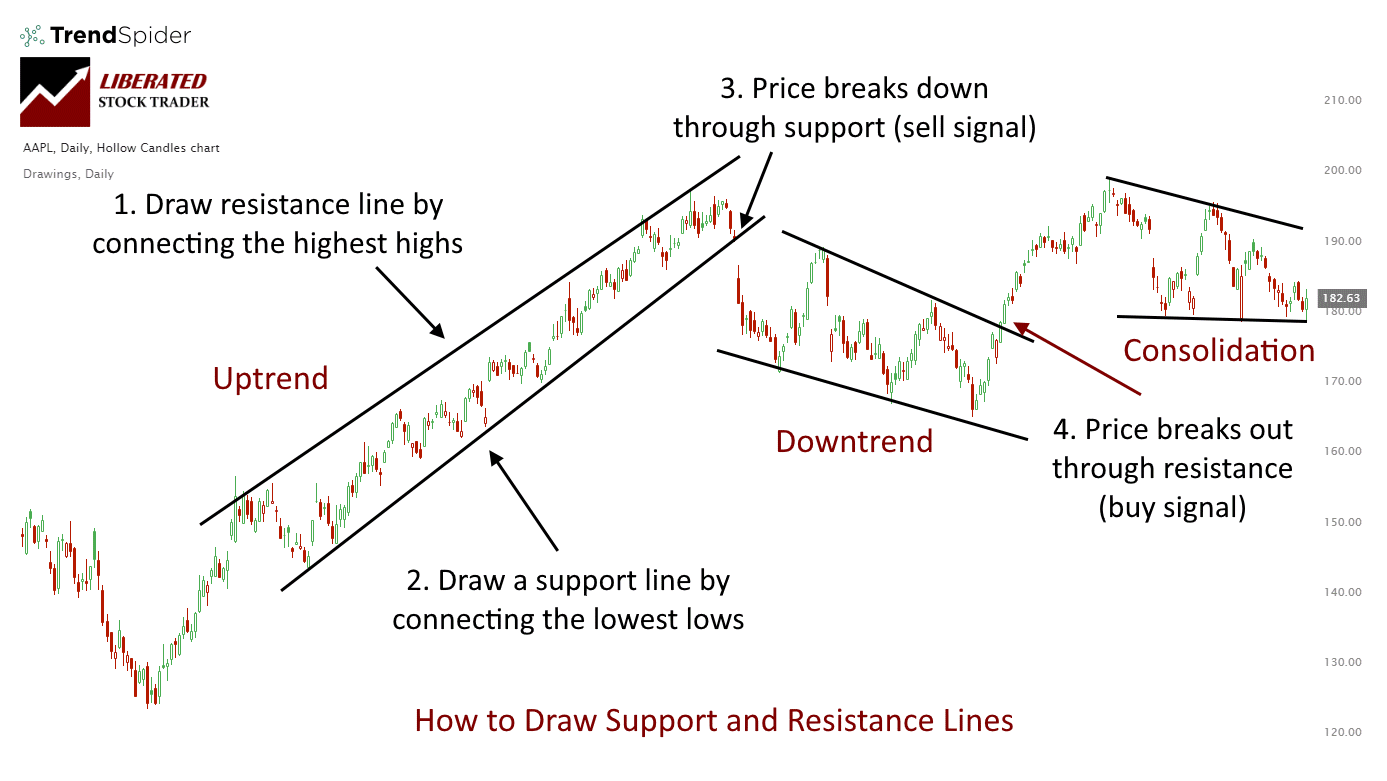
To draw effective trendlines, you need to connect the highest price highs, which is the resistance line. Then, you connect the stock price’s lowest lows, which is the support line.
When the price breaks up through the resistance line, it is a new high and a potential buy signal. This could be a sell signal when the price breaks down through the support line.
3 Types of Stock Price Trends
- Uptrend – This is a series of increasing highs and lows over time. A stock in an uptrend can show periods of consolidation, but the overall trend should be up.
- Downtrend – This series of decreasing highs and lows indicates that the stock price is moving downwards. A downtrend can also have periods of consolidation, but the overall trend should be down.
- Sideways Trend – This is when a stock price tends to move in a sideways pattern for an extended period. There is usually no clear direction with sideways trends, and they can last for several weeks or even months.
It’s important to note that these trends are not always clear-cut. There can be periods when a stock is moving in an uptrend but shows signs of a potential sell signal or a downtrend that may show signs of a potential buy signal. This is why it is important to follow technical analysis and monitor support and resistance points.
Time frames must also be considered when evaluating a trend; for this, we will refer to Charles Dow’s classification in Dow Theory.
3 Stock Trend Timeframes
- Long-term Trend – This is the longest trend and can last for months or years.
- Medium-term Trend – This trend typically lasts from weeks to months and can be in the direction of the long-term trend or move in the opposite direction.
- Short-term Trend – A minor trend usually lasts from a few days to weeks and is typically the trend that day traders follow.
By understanding these different time frames, traders can identify potential entry and exit points to better capitalize on a stock’s price movements. Awareness of these three trends will also help determine when an investor should stay out of the market to avoid larger losses in their portfolio.
You could be specific about the market trend by combining the above terms. For example, you could say the market is in a short-term up-trend but a long-term down-trend. But isn’t that contradictory, the market being both an uptrend and a downtrend simultaneously?
Not really; it makes perfect sense.
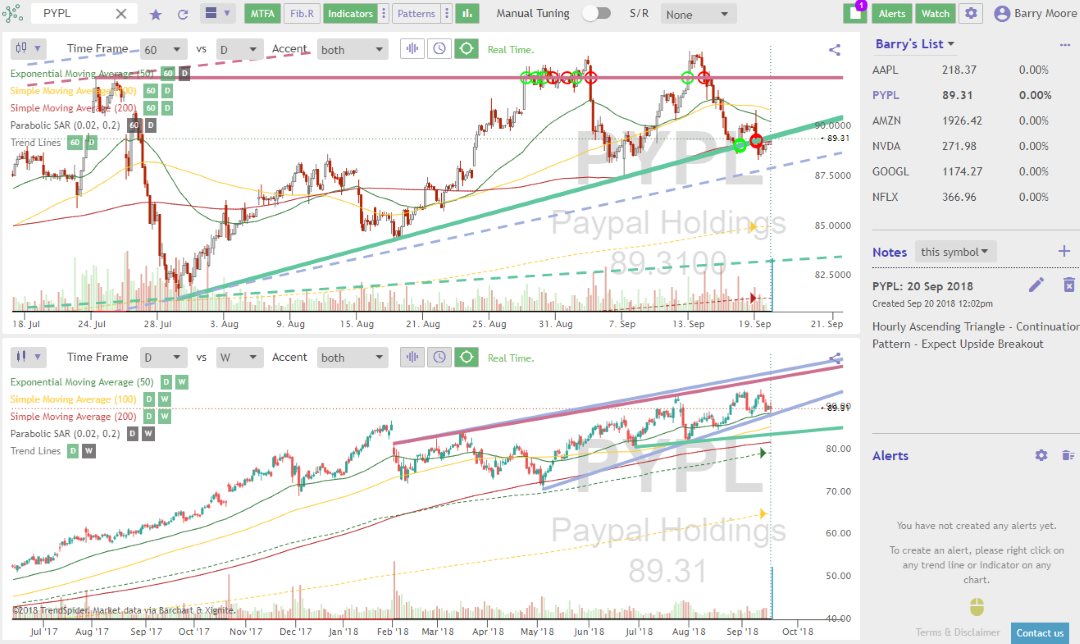
Chart: Trendline Timeframes

Drawing trendlines is one of the essential skills of technical analysts; trendlines represent important areas of support and resistance. Once you have this skill, charts come to life and start to signal their message to you.
Automatically Drawing Trendlines on Charts
To quickly and easily draw perfect trendlines on stock charts, you can use TrendSpider. TrendSpider’s AI-powered algorithms accurately find the best trendlines for you in seconds. It also detects chart patterns, Elliott Waves, and Fibonacci Retracements.
This way, you can quickly identify support and resistance levels, target price points, and entry and exit points and make smarter decisions when trading stocks.
How to Draw Uptrends
When a market is in an uptrend, prices should make higher highs and lows. Although prices may pull back during the uptrend, they should not break through the previous low. To draw an uptrend line, you start by identifying two consecutive peaks. Then, you connect those peaks with a straight line. The same process confirms the uptrend line when another peak is created.
Example: Drawing Uptrend Trendlines
- To evaluate an upward trend, draw a line joining the highest highs
- For the floor of the uptrend, draw a line connecting the lowest lows. The price here bounces three times off the bottom line but then proceeds higher.
- A trendline is drawn to show that the price has moved strongly past the previous high. This is a BUY Signal at $35.50.
- Finally, the price is exhausted and falls through the bottom resistance line at $51. This break of the upward support line is a sell signal.
Quick Tip: The more bounces off a trendline the stronger the trend.
Buying and selling based on the trendlines shown here would have bagged you a 49% win. Alas, life is never that easy, and showing this in retrospect does mean we have the benefit of hindsight.
How to Draw Downtrends
When a market is in a downtrend, prices should be making lower highs and lower lows. Although prices may rally during the downtrend, they should not break through the previous high. To draw a downtrendline, you start by identifying two consecutive troughs. Then, you connect those troughs with a straight line. The same process confirms the downtrend line when another trough is created.
Identifying and drawing trendlines is an important skill for any trader or investor. By recognizing these patterns in a chart, you can understand the overall market sentiment and make more informed decisions. Understanding trendlines can also help you anticipate future price movements to make better trading and investing decisions.
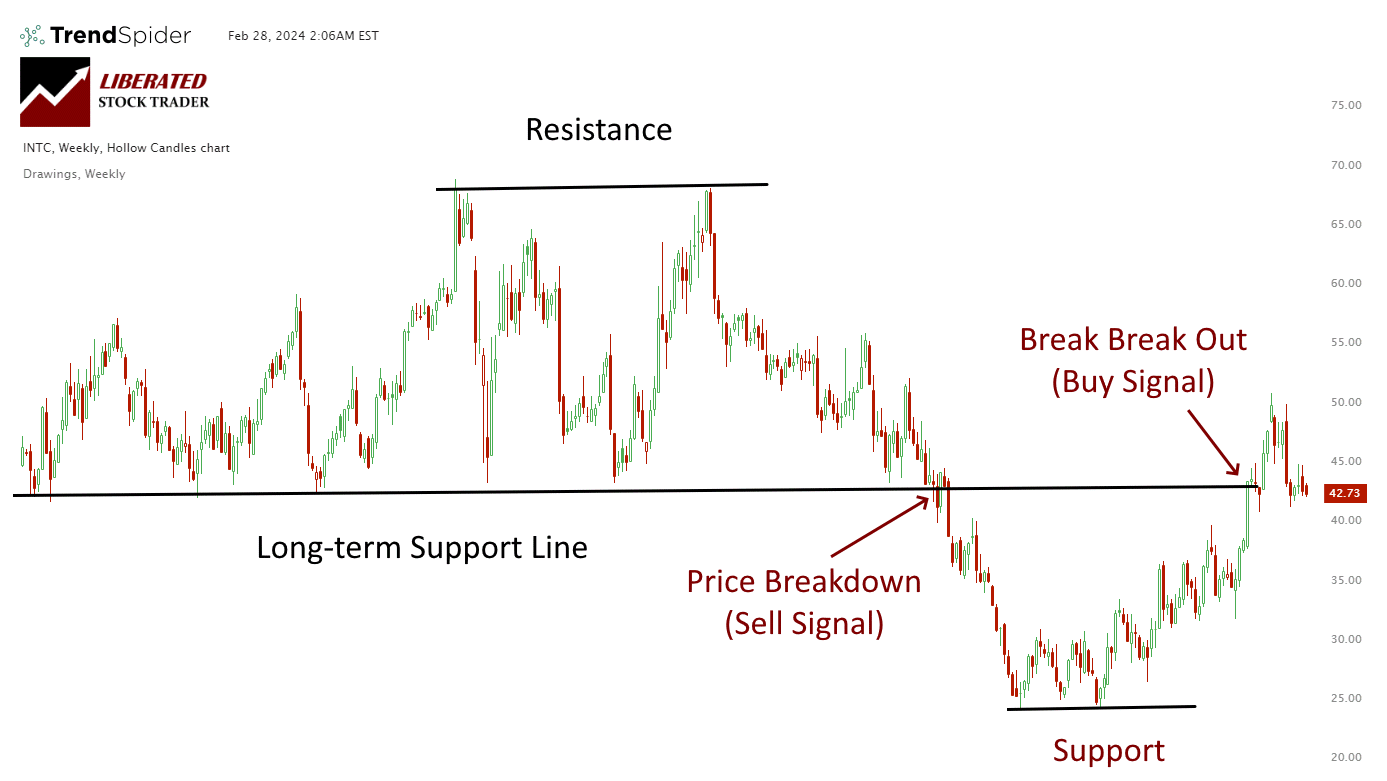
How to Draw Support & Resistance Lines
It would be best to practice drawing trendlines as much as possible. After a while, you will get used to it, and it will become second nature.
Here is another example of how to draw trendlines. This is a chart of Ticker: AAPL Apple Inc. It shows how to draw trendlines in a downward and upward price move.
TradingView 4.8/5⭐ : The Best Trading Platform I’ve Tested in 20+ Years
With lightning-fast charts, powerful pattern recognition, smart screening, backtesting, and a global community of 20+ million traders — it’s a powerful edge in today’s markets.
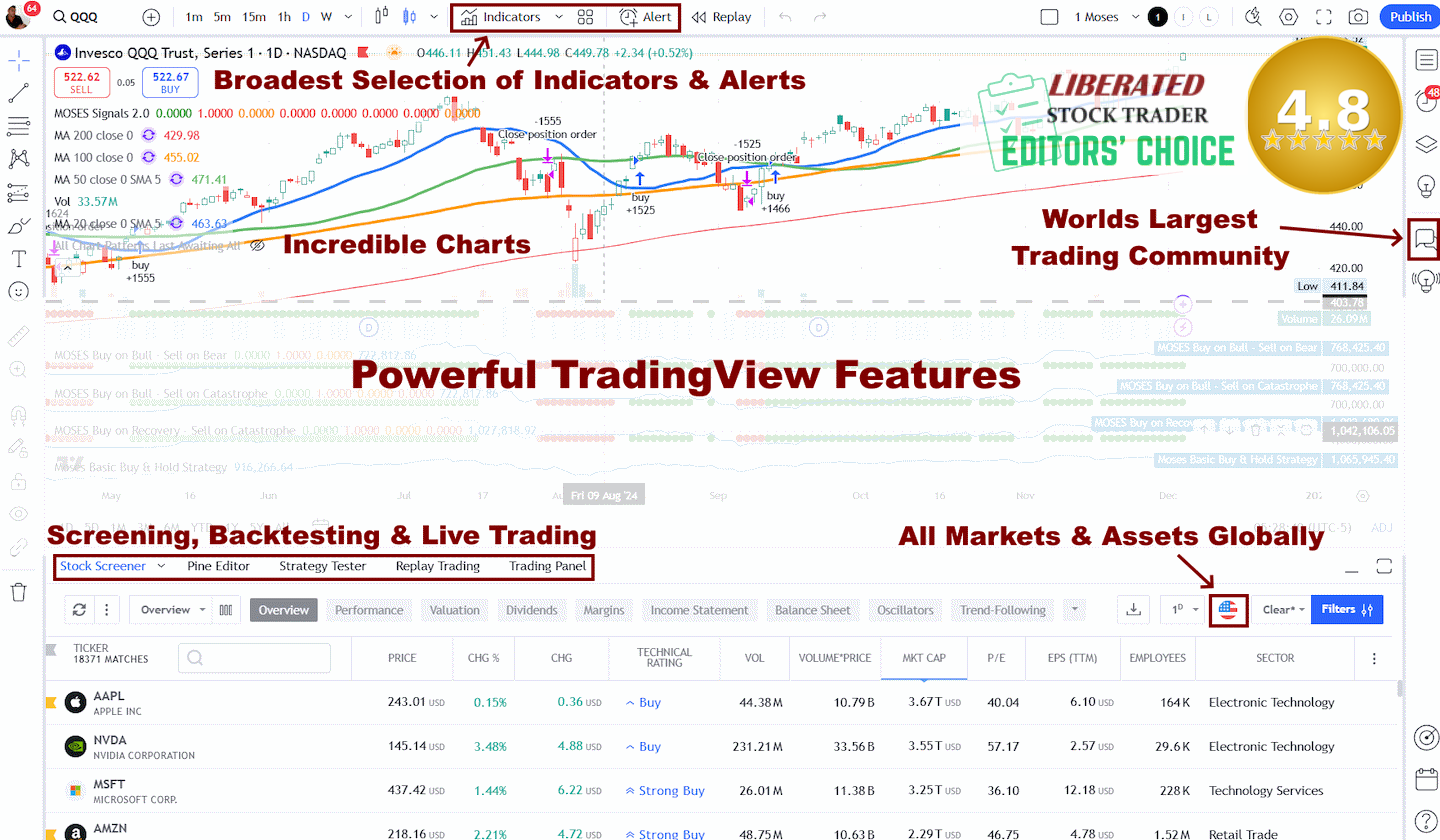
If you want one platform that gives you an edge, this is it.
FAQ
Can you automate trendlines on stock charts?
Yes, it is possible to fully automate trendlines on stock charts using TrendSpider. TrendSpider uses AI algorithms to plot trendlines on charts on multiple timeframes, which is a game changer for traders. TrendSpider also automatically identifies chart patterns, Fibonacci and Elliot Waves.
Do trendlines work?
Yes, trendlines are an extremely powerful and reliable tool for traders. They can be used to identify support and resistance levels with a visual way to track the price movements of stocks and other assets over time. With TrendSpider's automated system, trendlines become accurate and fast to plot on charts.
How do you identify a trend line?
To identify a trend line, you will need to plot at least two points on the chart. A straight line should then be drawn connecting these two points and extend until it intersects with another point. Once this is done, if the price continues to touch or cross the line in an upward motion, you have identified an uptrend.
Do professional traders use trendlines?
Yes, professional traders use trendlines in their trading strategies as they are an extremely effective tool for predicting price movements and understanding asset behavior. With TrendSpider's automated system, trendlines can be automatically plotted accurately and quickly to help traders analyze the market with precision.
How to draw stock chart trendlines?
To draw stock trendlines, identify two trading points on the chart, connect them with a straight line, extend the line into the future to predict the price. With TrendSpider's AI charts, trendlines are automatically drawn for you using advanced algorithms and patterns.
Do professional traders use trendlines?
Yes, professional traders use trendlines in their trading strategies as they are an extremely effective tool for predicting price movements and understanding asset behavior. With TrendSpider's automated system, trendlines can be automatically plotted accurately and quickly to help traders analyze the market with precision. All professional traders use trendlines for visualizing market direction and as a core for trading strategies.
What makes a trendline strong?
A trendline is considered strong when it consistently connects several points on a chart, forming a consistent and reliable pattern. A trendline should also have an adequate number of touches in order to be considered reliable. The more touches on the line, the stronger the trendline.
What are the rules for trendlines?
The most common rules for trendlines are:
- The line should connect two or more points on the chart
- Each time a new point is added, the line should be redrawn to reflect the current trend
- Price should consistently respect a trendline in order for it to be considered reliable
- The more touches on the line, the stronger it is considered to be
- A break of a trendline indicates that the previous trend has ended, and a new one may have started.
When should you add a trendline?
Trendlines should be added when the price action of an asset is clearly moving in a certain direction. This indicates that there is a strong trend that can be used for trading opportunities. It's important to remember that trendlines should not be drawn arbitrarily; they should only be drawn after at least two points have been established and connected with the line.
When should you redraw a trendline?
A trendline should be redrawn when there is evidence that the underlying price action of an asset has changed direction. For instance, if the price breaks through a previously established trend line or fails to reach it in the first place, it may be time to redraw or adjust the trendline.
What happens when a trendline is broken?
When a trendline is broken, it can indicate that the underlying asset price has changed direction. This could lead to potential losses if trades are entered too early without further analysis of the market movement and context. Additionally, it is best practice to wait for some confirmation of the break before making any decisions, as there may be an opportunity to enter into more favorable positions.