My research shows that the best stock market heat maps are TradingView, Finviz, and Stock Rover.
TradingView is visually stunning and covers all stock, forex, and crypto exchanges, and Finviz provides a world-view heatmap with drill-downs. Stock Rover also offers compelling alternatives.
While there are many stock market heatmaps available, I have compiled a list of seven of the best options currently on the market.
Stock Market Heatmap Ratings
| Heatmap | 🎯 Rating | 🌎 Markets |
| TradingView | ★★★★★ | Global |
| Finviz | ★★★★★ | USA |
| Stock Rover | ★★★★✩ | USA |
| Yahoo | ★★★★✩ | Global |
| Barchart | ★★★✩✩ | USA |
| MarketBeat | ★★✩✩✩ | USA |
| StockCharts.com | ★★✩✩✩ | USA |
How Do Heatmaps Help You Trade?
The stock market heatmap is a popular tool for traders seeking to visualize large, real-time datasets, including stock price changes, volatility, and volume. The heatmap’s easily digestible format enables traders to quickly understand big data, helping them make more informed investment decisions. Heatmaps can prove invaluable in helping investors easily understand complex market behavior and make smarter decisions.
Stock Heatmap Review Test Results
1. TradingView: Winner Best Stock Heatmaps
Covering 84 exchanges globally, TradingView features 45 fundamental and technical filters, offering the fastest and most visually appealing heatmaps available today.
| TradingView Heatmaps | Summary |
| ⚡ Heatmap Features | Fast, Visually Stunning, 45 Filters |
| 🏆 Unique Features | 84 Stock, Crypto & Forex Exchanges |
| 🎯 Best for | Stock, Fx & Crypto Traders |
| 🆓 Free Version | TradingView Free |
| 🎮 Premium Trial | Free 30-Day |
| ✂ Premium Discount | $15 Discount + 30-Day Pro Trial |
| 💰 Price | Free | $14/m | $28/m | $56/m annually |
| 🌎 Markets Covered | Global |
The TradingView heatmap system is available for 84 exchanges, including those in the USA, India, China, and Europe. What makes it special is its speed and flexibility. Most heatmaps are sorted by market capitalization, but TradingView enables the heatmap to be sorted on price, volume, performance, the number of employees, dividend yield, PE ratio, and even price-to-book ratio.
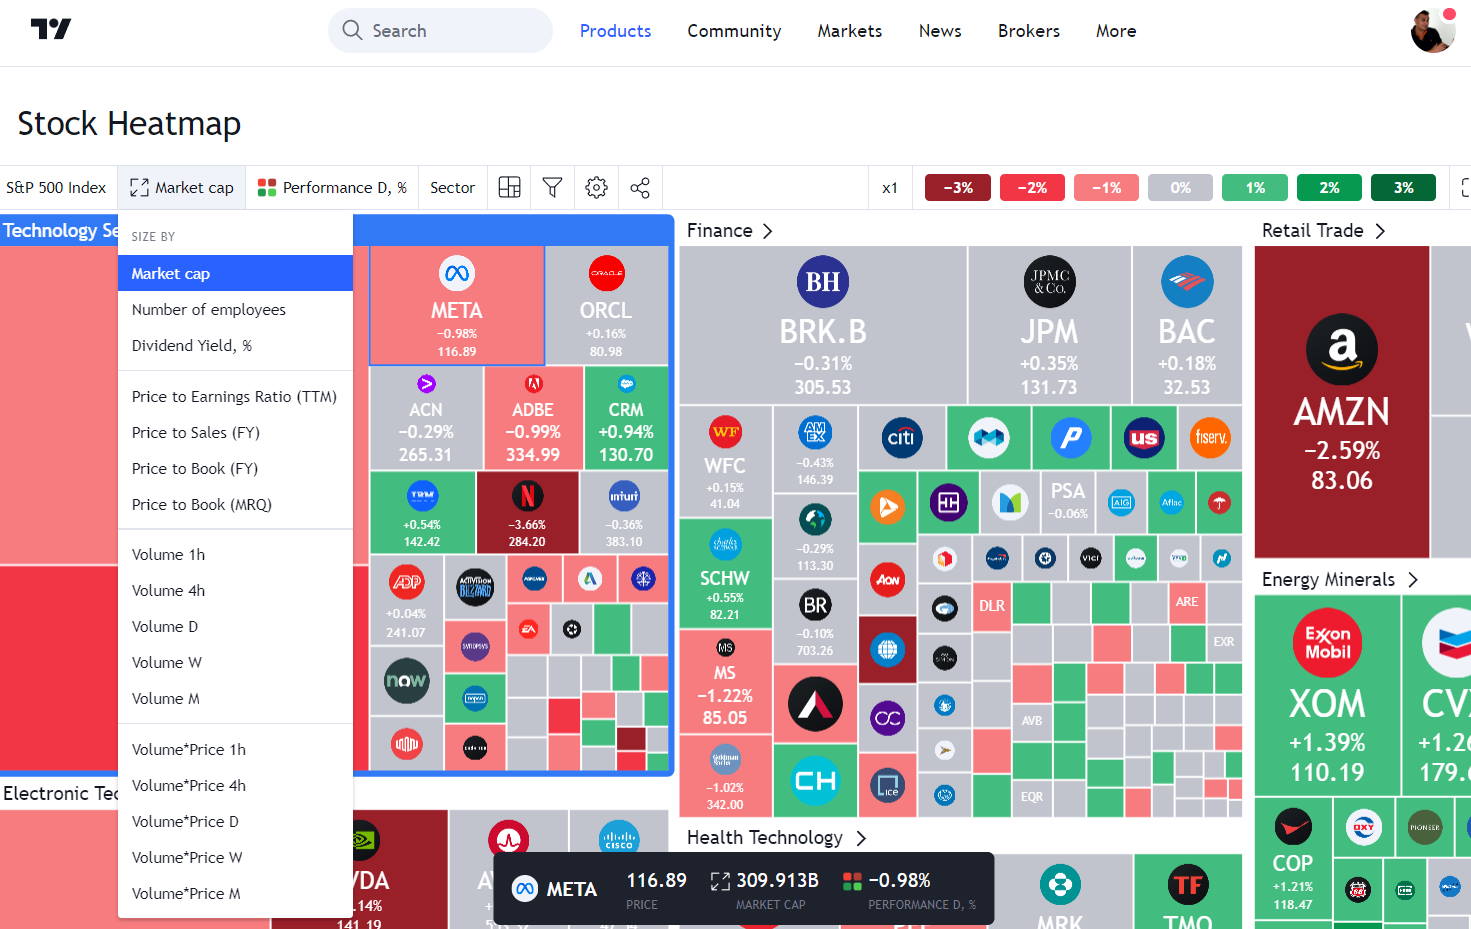
TradingView’s heatmap includes company logos, which makes it incredibly easy to use. A single click also takes you to a detailed company overview, complete with financials and advanced charting.
Finally, TradingView’s heatmaps are not just for stocks but also include Forex and Cryptocurrency. Perhaps best of all, they are included in its free service tier.
2. Finviz: Best World Heatmap
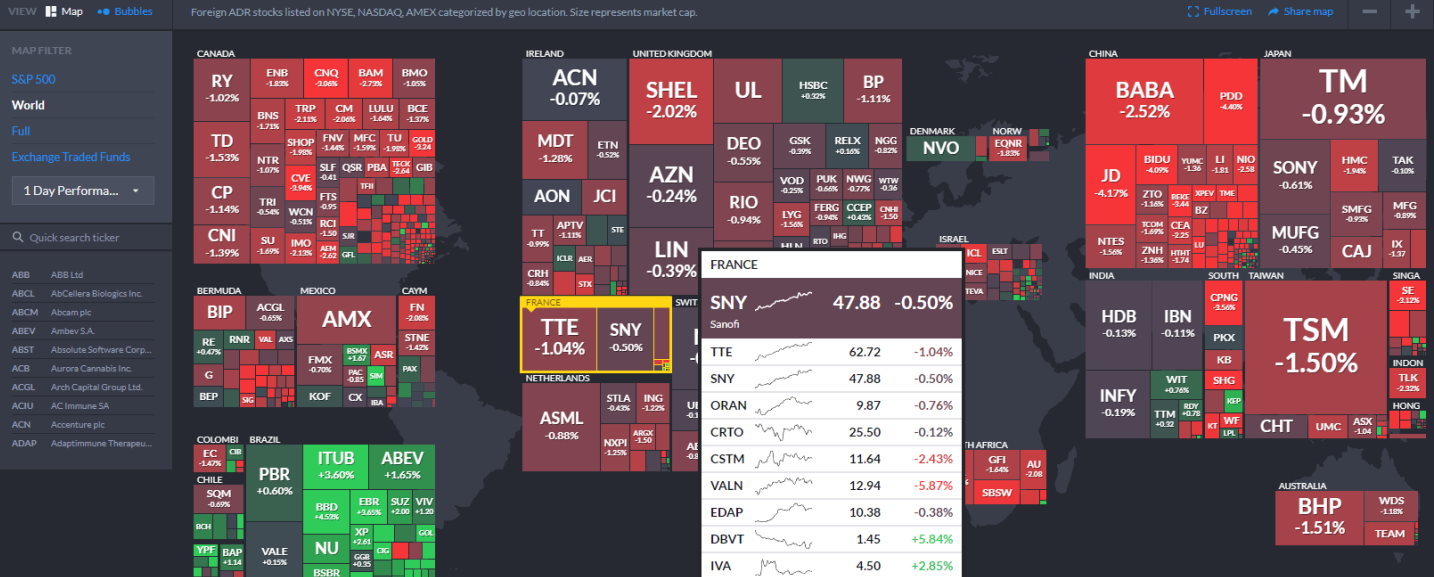
Finviz is the only heatmap that shows 24 of the world’s stock markets on a single screen. Finviz is lightning fast, and by hovering over a ticker symbol, you see a selection of mini-charts showing the performance of every company in the same industry sector.
| Finviz Heatmaps | Summary |
| ⚡ Heatmap Features | World View, Mini Charts |
| 🏆 Unique Features | 24 Filters, Stocks & ETFs |
| 🎯 Best for | Stock Investors |
| 🆓 Free Version | Yes |
| 🎮 Premium Trial | 30-Day Money-Back |
| ✂ Premium Discount | -40% With Annual Plan |
| 💰 Price | $39.50/mo or $25/m annually |
| 🌎 Markets Covered | USA |
In the screenshot below, I hovered over France TTE and can instantly see the competing companies in the sector; this is very impressive.
Finviz is more than just a heatmap service; it provides first-class stock screening and effective stock chart pattern recognition. Its premium service includes real-time data and powerful backtesting capabilities.
Finviz is the granddaddy of stock analysis software and is well worth further investigation; read our Finviz review to find out more.
3. Stock Rover: Personalized Portfolio Heatmaps
Stock Rover provides heatmaps for serious investors. With stock performance ratings, research reports, portfolio analysis, and management tools, Stock Rover is the best choice for value, income, and long-term growth investors.
| Stock Rover Heatmaps | Summary |
| ⚡ Heatmap Features | Personal Portfolio Heatmaps, Unique Stock Ratings |
| 🏆 Unique Features | Broker Integrated Heatmaps, Portfolio Analysis, Stock Research |
| 🎯 Best for | Stock Investors |
| 🆓 Free Version | Try Stock Rover Free |
| 🎮 Premium Trial | 14-Day Free |
| ✂ Premium Discount | -25% During Premium Trial Period |
| 💰 Price | Free or $28/m or $23/m annually |
| 🌎 Markets Covered | USA |
Stock Rover allows you to connect to your brokers and provides unparalleled portfolio analysis, research, and rebalancing tools. The special feature is that Stock Rover provides a single heatmap of all your assets, enabling you to see the current performance, profit and loss, ROI, and total percent gain.
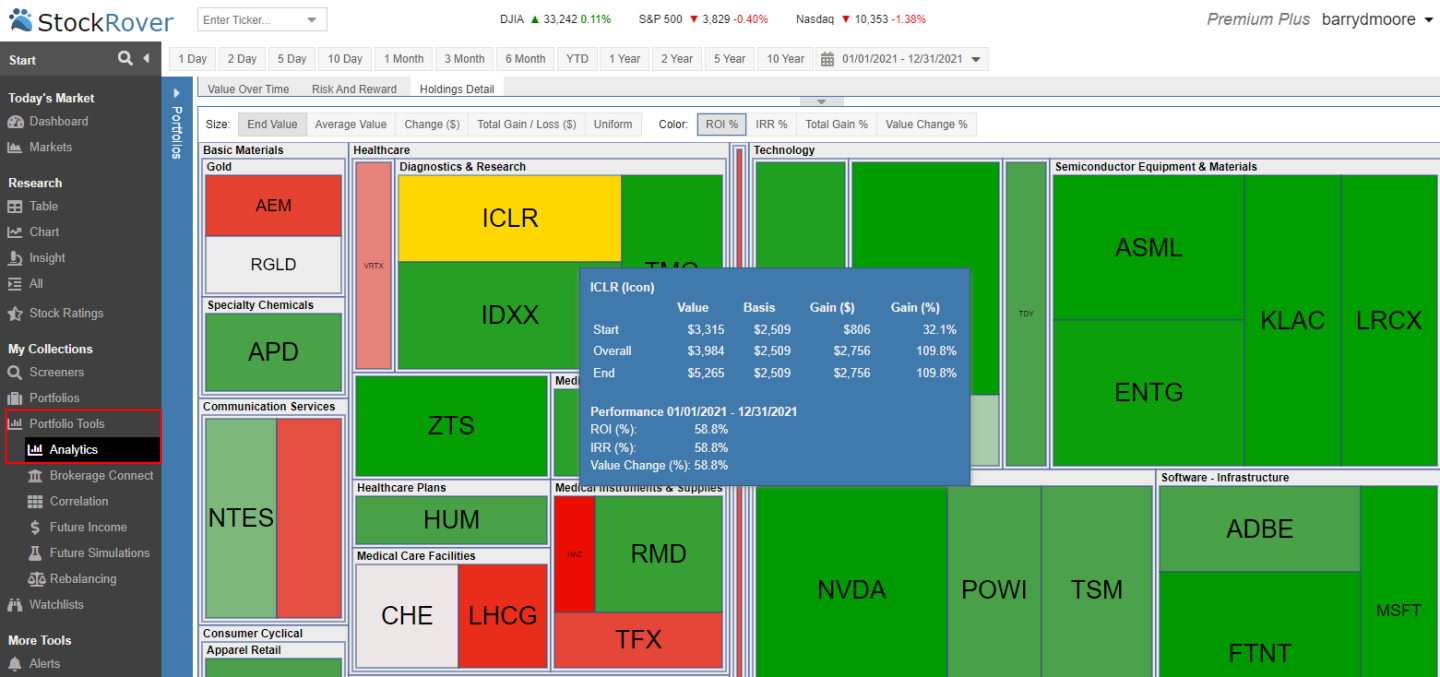
In addition to personal portfolio heatmaps, you get our award-winning best stock screener, including real-time unbiased stock research reports and access to my Liberated Stock Trader, “Beat the Market System,” developed exclusively for Stock Rover.
Stock Rover 4.7/5⭐ : My Top Pick for Smart Investors
Investing In Stocks Can Be Complicated. Stock Rover Makes It Easy.
★
Growth Investing - with industry-leading
Research Reports ★
★ Value Investing - using Warren Buffett's Fair Value and Margin-of-Safety ★
★ Income Investing - rank by yield, growth, quality, and safety using 650 metrics ★

"I have been researching and investing in stocks for 20 years! I now manage all my long-term investments using Stock Rover." — Barry D. Moore, Founder: LiberatedStockTrader.com
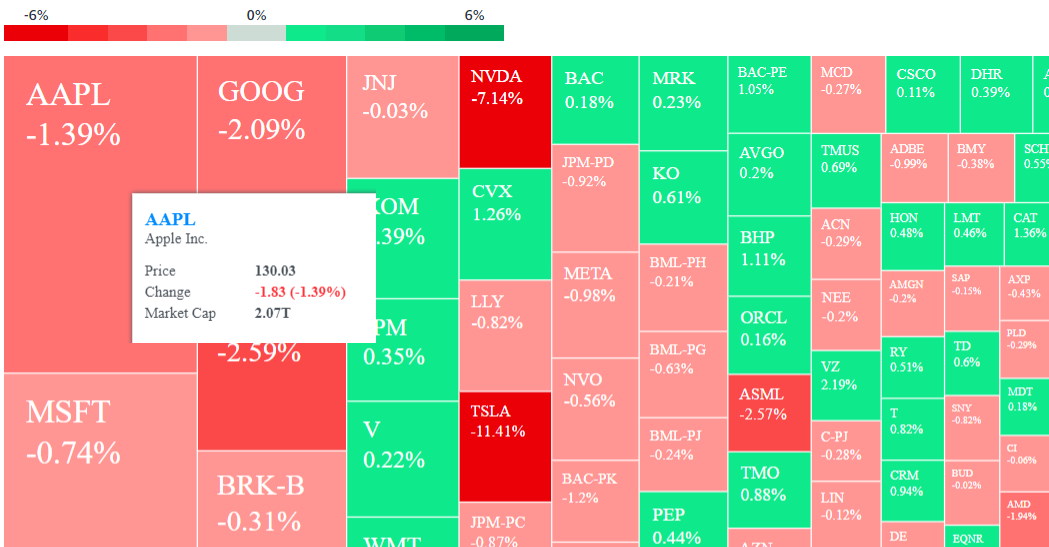
4. Yahoo: Free International Heatmaps
With 54 countries covered, Yahoo heatmaps provide a good way to visualize international stock market performance. Yahoo Finance also provides 101 stock filters, including five short interest metrics: dividend, debt, liquidity, EPS, cash flow, and ESG scores.
The screenshot below shows the depth of sorting and filtering of stocks.
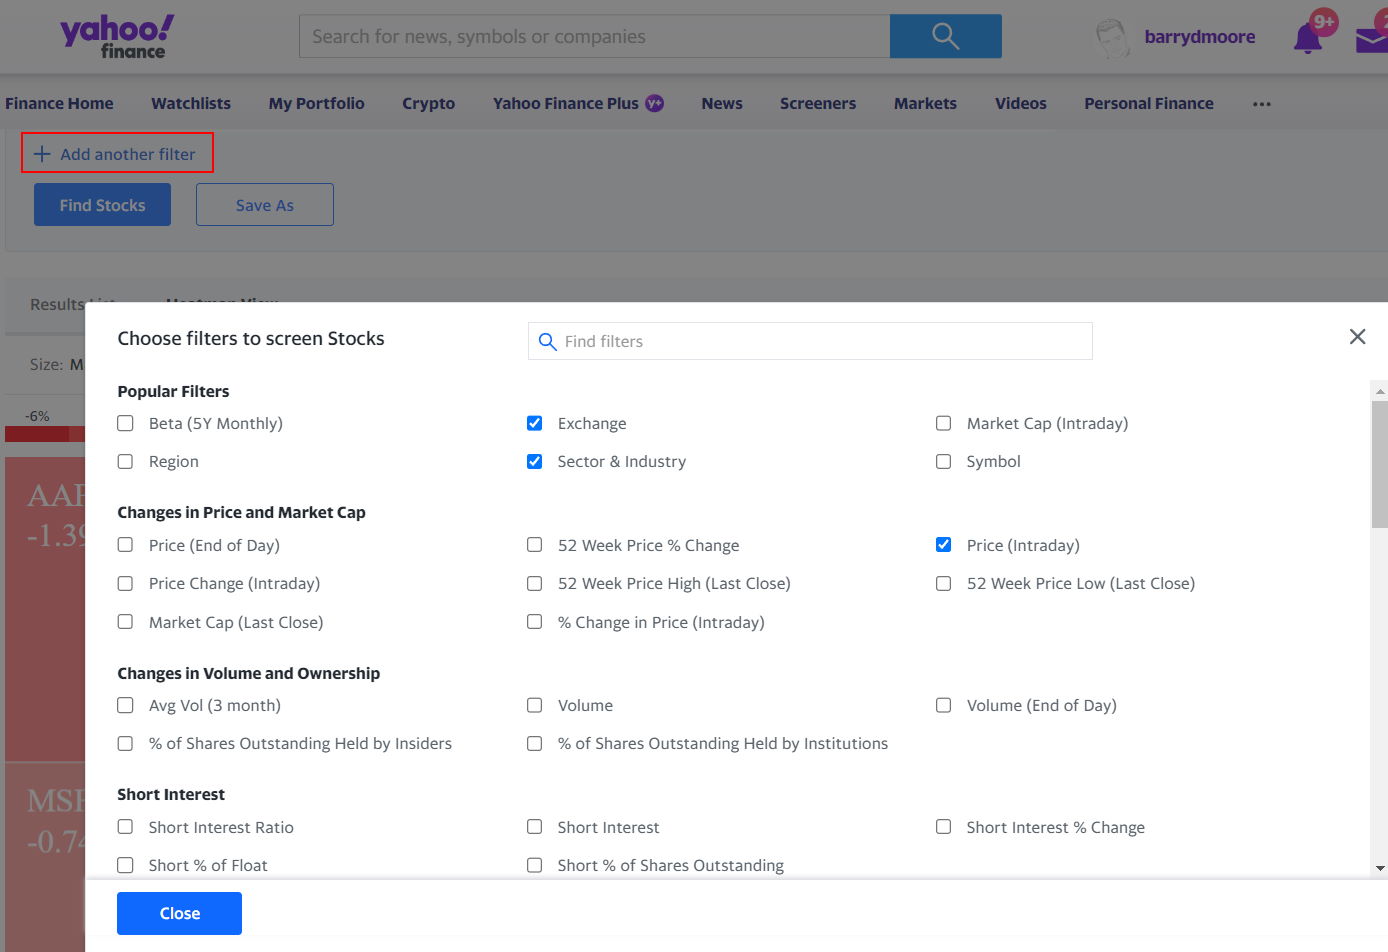
While the Yahoo heatmaps look basic, clicking on a ticker symbol brings up a page with news and financial information. I cannot help but think that more input from actual traders would turn Yahoo Finance into an excellent tool worth paying for.
5. Barchart: US Heatmaps & Sectors
Barchart provides a reliable heatmap service for US investors, including filters for price-to-earnings, EPS, annual dividend, and dividend yield. Additionally, being able to screen a heatmap on a 60-month beta is unique.
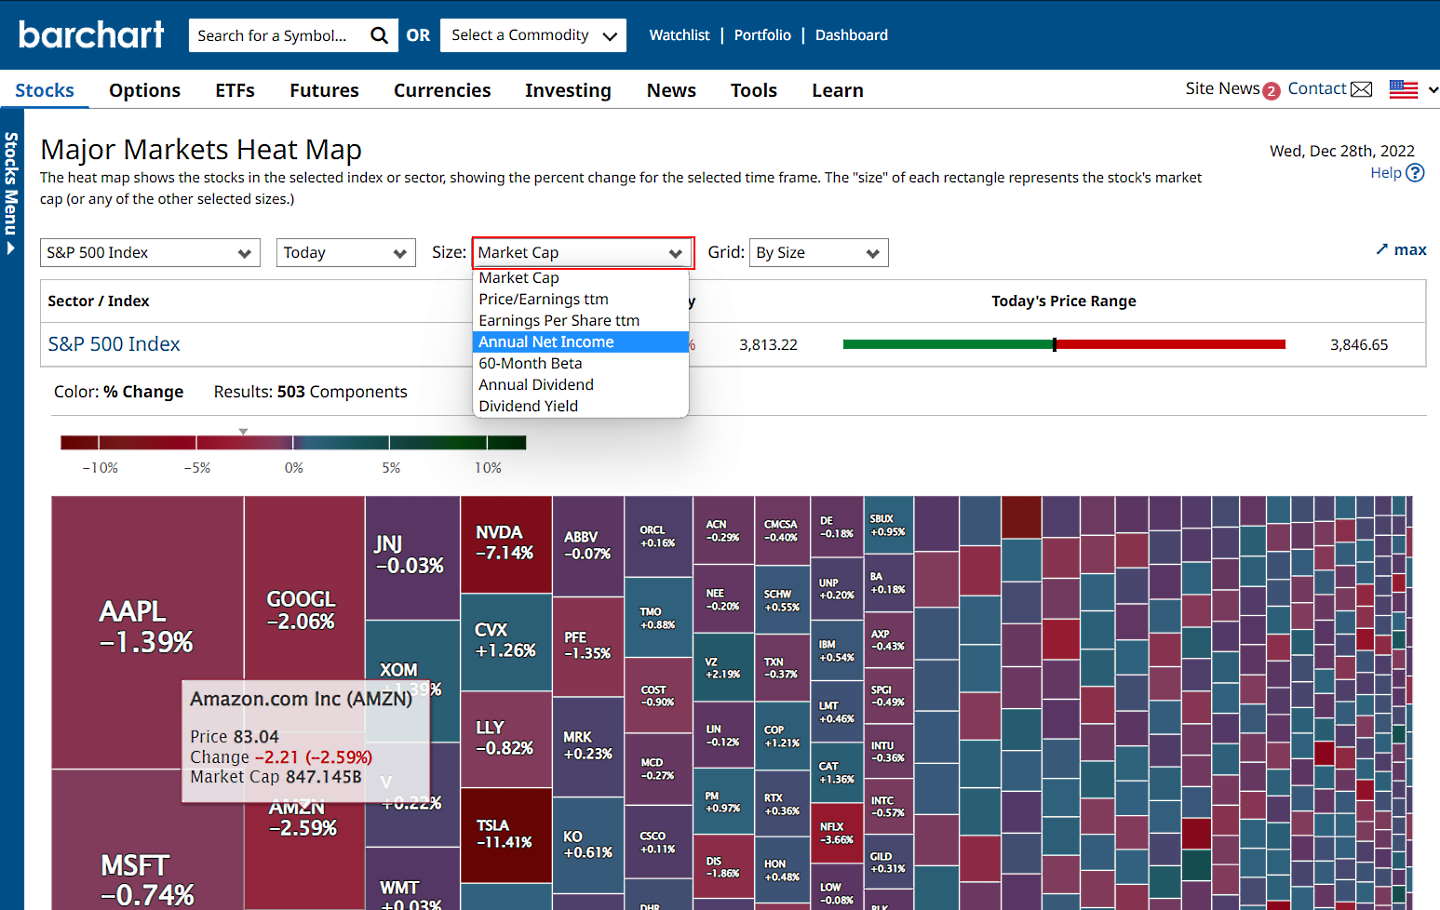
Barchart provides much more than a simple heatmap, specializing in commodity futures, options, stocks, and ETF trading. Barchart might serve the more advanced investor.
6. MarketBeat: US Stock Heatmaps & Poor User Experience
At first glance, MarketBeat’s stock heatmap is visually appealing and promises a wide variety of data; however, the experience is short-lived. Unfortunately, my testing revealed that the Marketbeat team has decided to force its customers to register for free access and then push them to watch upsell videos and sign up for premium newsletters.
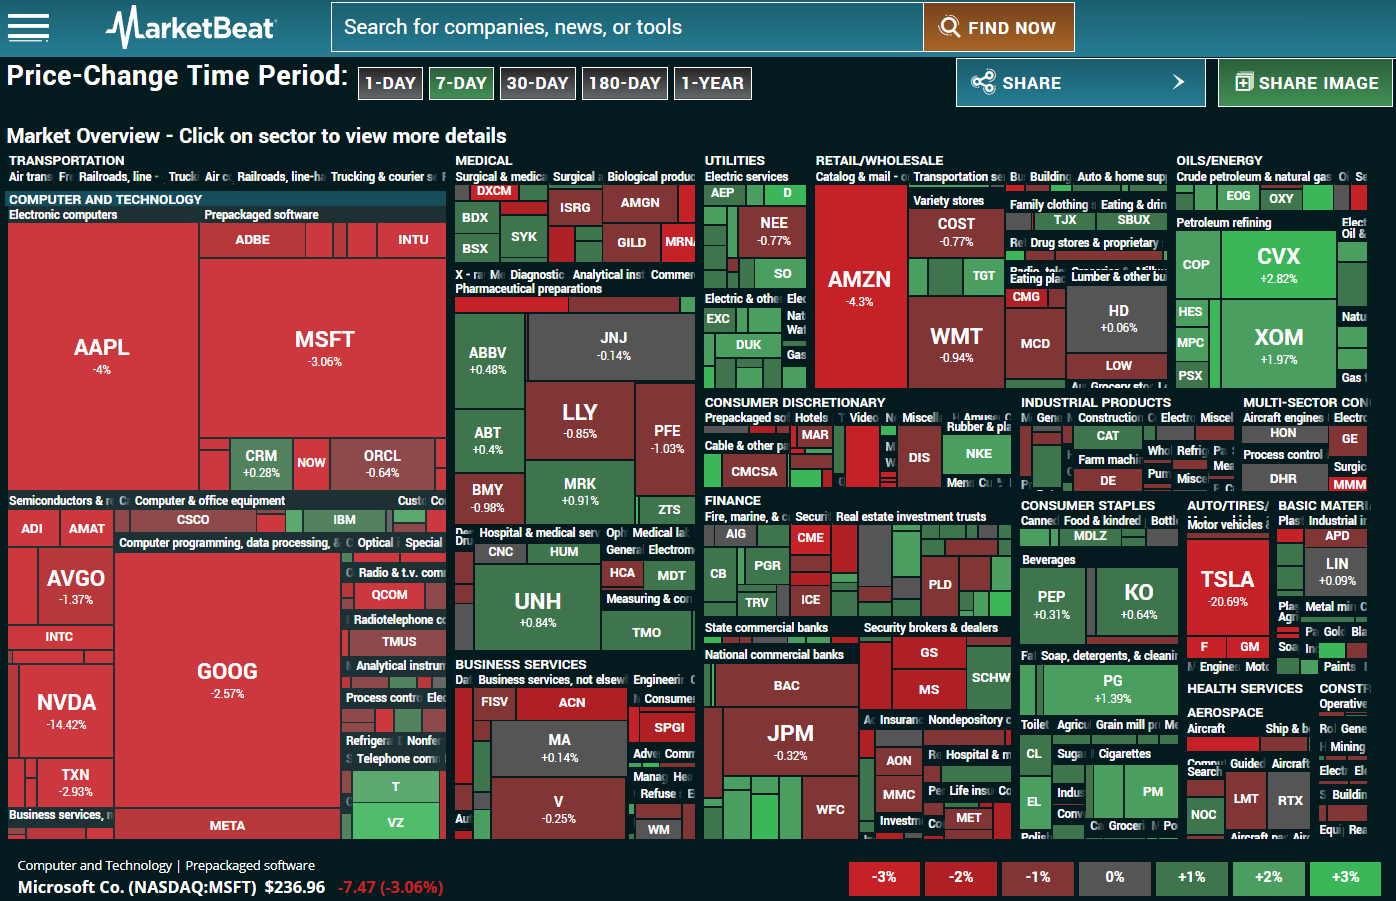
I would avoid MarketBeat because it is an endless source of harassment to obtain your personal information and requires a paid subscription without providing any real features or benefits. Additionally, if you register with MarketBeat, you will receive numerous marketing emails from their partners.
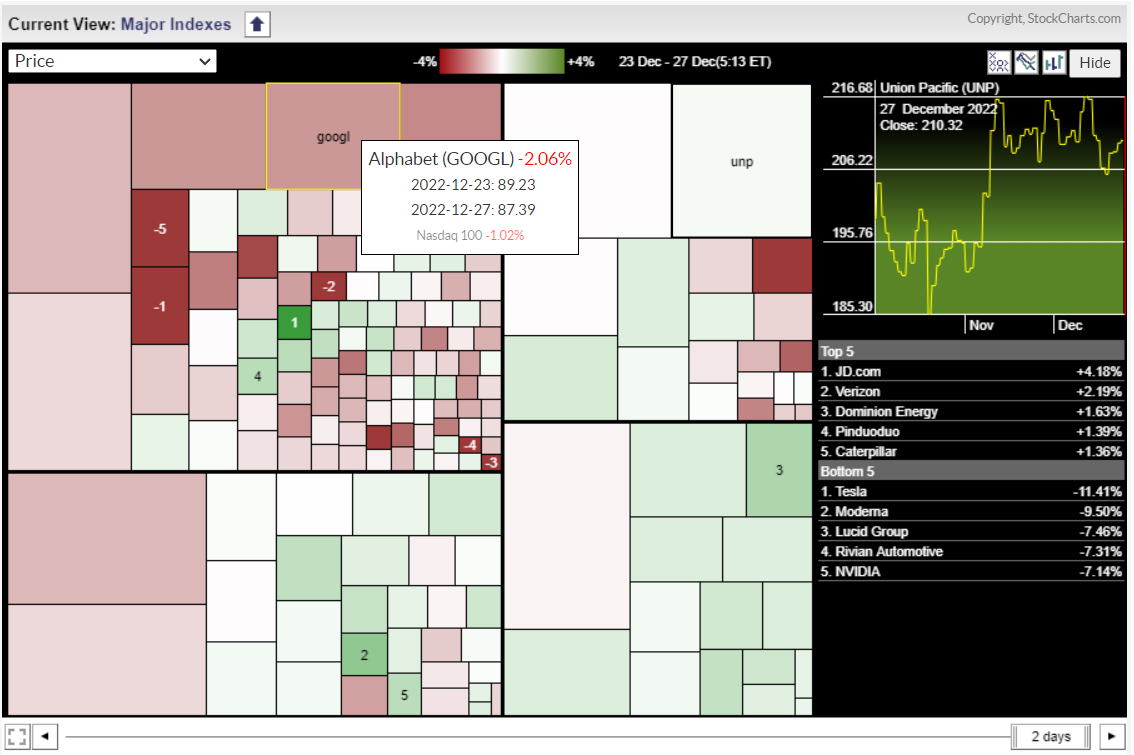
7. StockCharts.com: Non-Functioning Heatmaps Worth Avoiding
Contrary to popular belief, our testing reveals that the Stockcharts.com stock market heatmaps are worthless. Stockcharts.com provides a valuable charting and analysis service with millions of subscribers. However, the Stockcharts.com heatmap does not function properly, as shown in the screenshot below.
Tips for Using Heatmaps Effectively
A stock market heatmap can be a valuable tool for investors seeking to gain a comprehensive understanding of the markets. Understanding how to use a stock market heatmap is crucial for identifying where the market action is concentrated.
- First, investors should understand their objectives and goals before using a heatmap. Then, they should familiarize themselves with the map’s features and what each color signifies.
- Next, investors will want to examine long-term trends and short-term fluctuations to assess a stock’s strengths and weaknesses relative to other stocks in the same sector.
- Reading a stock market heatmap can also provide important information about which sectors are currently overpriced or undervalued.
- Last but not least, investors need to stay up-to-date with current news specific to the stocks they are monitoring to monitor any changes and take advantage of opportunities that may arise quickly in a volatile market environment.
By applying these five tips, you will be well on your way to effectively navigating the stock market and gaining valuable insights into potential portfolio investments.
Getting started with stock market heatmaps
Investing in the stock market can seem intimidating and overwhelming, but using stock market heatmaps is a great way to reduce stress. Heatmaps are an excellent tool for investors, as they present stock movements graphically, allowing trends to be easily identified.
To start with a heatmap, it is important to familiarize oneself with reading and interpreting it. Additionally, ensure that the heatmap data originates from reliable sources, such as major exchanges and reputable online financial sites. Furthermore, individual stocks should be looked at carefully before making any final decisions based on the information from the heatmap. With some practice and knowledge of this useful visualization tool, anyone can become an investor with valuable insight into any given stock market sector.
Summary
My research results reveal that TradingView, Finviz, and Stock Rover are today’s best stock heatmaps. Heatmaps are a valuable tool for stock market analysis, as they enable you to visualize data clearly and intuitively.
If you’re new to heatmaps, start with one of our top stock market heatmap tools listed in this post. Once you get the hang of it, you can use heatmaps to your advantage by following simple tips and tricks. You can make better investment decisions and improve your stock market performance with a little practice.