Technical Analysis, Charts, Patterns & Indicators
Learn technical analysis and how to read stock charts. This helps you understand the movement of stock prices, stock trends, and the supply-demand equation. Stock chart indicators and market sentiment are all important factors.
The Best Software for Trading & Stock Chart Analysis
7 Epic AI Stock Trading Tools & Bots Fully Tested 2025
My research identifies Trade Ideas and TrendSpider as the leaders in AI trading software. Trade Ideas offers automated trading and bots, while TrendSpider offers automated pattern recognition, auto-trading, and backtesting.
Trade Ideas Review 2025: AI Day-Trading Full Test & Rating
My testing awards Trade Ideas 4.7 stars. Its stock scanner, alerting, and algorithmic trading signals are advanced and trustworthy. Brokerage Plus auto-trading is a great feature for experienced traders.
Is TradingView Worth It? In-Depth Test & Rating 2025
My 2025 testing awards TradingView 4.8 stars due to its continued innovation in chart analysis, pattern recognition, screening, and backtesting. TradingView is my top recommendation for US and international traders.
TrendSpider Review 2025: Is Its AI & Automation Worth It?
My testing awards Trendspider 4.8/5 stars due to its innovation. Its powerful algorithms automatically recognize trendlines, chart patterns, and candlesticks. It also has automated trading bots, real AI LLMs, and powerful point-and-click back-testing.testing.
Benzinga Pro Review 2025: Realtime Trading News On Test
My extensive testing of Benzinga Pro reveals a trustworthy real-time news screening and charting service for day traders. It includes alerts, insider block trades scanning, and unusual options activity signals for US markets.
MetaStock R/T Review 2025: Full Hands-on Test & Rating
My MetaStock testing highlights it as a robust trading platform. It offers over 300 charts and indicators for global markets, including stocks, ETFs, bonds, and forex.
Stock Trading Courses You Might Enjoy
Our Free Stock Trading & Investing Training
Liberated Stock Trader offers free stock investing courses covering value, growth, dividend investing, and technical chart analysis. Our courses are developed by IFTA member and certified financial technician Barry D. Moore.
35 Best Growth Stocks To Buy Now To Beat The Market
The LST Beat the Market Growth Stock Strategy has outperformed the S&P 500 in 10 of the last 12 years, providing a 12-year total return of 655%, beating the S&P 500 by 84%.
Epic 14-Video Guide to Technical Analysis for Traders
Our ultimate guide to technical analysis, with its 14 videos and detailed examples covering charts, trends, indicators, patterns, and tools, will fast-track your knowledge.
Unveiling the Secret Japanese Trading Tactics of Kagi...
Kagi charts provide traders with a unique perspective on price action, filtering out much of the noise and highlighting genuine trends.
Getting a handle on how to use Kagi charts, dialing in the right settings, and understanding how they compare to other chart types can really sharpen your technical analysis and trading decisions.
How to Identify & Trade Seasonal Trends in...
Seasonal trends refer to certain sectors, like retail, which often perform better during holiday seasons, while agricultural products might see spikes during harvest times.
Fear & Greed Index August 2025: Decode Market...
Our Fear and Greed Index goes beyond the basics, offering nine real-time and historical charts to help you stay ahead. With live data from the Federal Reserve, VIX CBOE, and 15 technical stock price signals, you'll have the tools to make smarter decisions today.
How Pro Investors Use Chart Trendlines to Make...
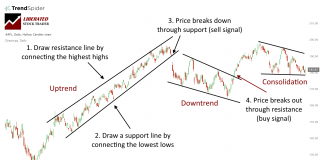
Trendlines are a visual representation of the trend direction in the stock market. They are formed by connecting two or more significant highs or lows on a stock chart, creating a diagonal line that indicates the general trend of the asset's price movement.
How to Trade Market Sentiment Using Live Chart...
Successful traders use market sentiment to gain a competitive edge and improve their chances of making profitable trades.
How To Analyze Stocks with Fundamental & Technical...
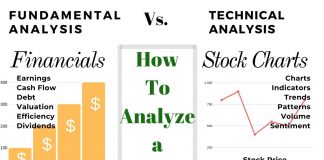
There are two ways to analyze stocks. Fundamental analysis, which evaluates criteria such as PE ratio, earnings, and cash flow. Technical analysis, which involves studying charts, stock prices, volume, and indicators.
Price Action Trading: Indicators, Patterns & Setups Guide
Price action trading is a method of day trading that relies on technical analysis but ignores conventional fundamental indicators, focusing instead on the movement of prices.
Elite Guide to Backtesting Trading & Investing Strategies
Experienced investors backtest their trading strategies to optimize their portfolios. Backtesting is a critical step that enables traders to assess the potential viability of a trading strategy by applying it to historical data.
12 Proven Ways to Trade Stock Chart Indicators Profitably
As a Professional market analyst, I build effective trading strategies using techniques such as indicator divergences, multi-time frame analysis, indicator combinations, and rigorous backtesting.
How to Trade 5 Mean Reversion Indicators: 120K Trades Tested
I conducted over 120,000 test trades on five key mean reversion indicators: Stochastics, RSI, Commodities Channel Index, MACD, and Bollinger Bands. Each indicator varies in reliability and profitability.
I Tested 23,487 RSI Trades: The Best Settings Proven
I tested 23,487 RSI trades on 820 years of exchange data. When configured correctly, RSI can be highly profitable, with a 53% success rate and an average of 65% winning trades. The RSI setting of 14 on a 1-hour chart is the most reliable configuration for identifying profitable buy and sell signals.
OBV Indicator Best Settings & Trading Strategy Explained
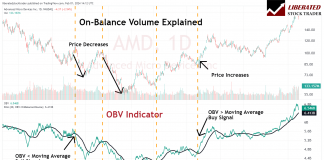
On-balance volume (OBV) is a cumulative indicator in technical analysis designed to show the volume flow relative to a security's price movements. The OBV reflects the collective buying and selling pressure crystallized through the volume trend.
How to Trade Pivot Points in Stocks Based on 66,480 Trades
Most technical traders believe that pivot points are a profitable strategy. However, my testing shows that only 33% of the stocks tested outperformed a buy-and-hold strategy, and on average, 70% of trades resulted in losses.
See My Test Results Before Trading Donchian Channels
I backtested Donchian Channels with 360 years of stock exchange data. My results reveal that 35% of trades are profitable, with a reward-to-risk ratio of 2.4:1. Unfortunately, this means Donchian Channels show only a minimal profit expectation of 0.2.
KDJ Indicator Explained: Best Settings & Strategy Tested
According to my detailed research, the KDJ is a reliable indicator, with a 63% success rate when properly configured. The best settings for the KDJ are the standard 9, 3, 3, 3, -2, and using Wilder's Moving Averages.
Is the S&P 500 200-Day Moving Average Profitable? I Test It
My testing of the 200-day moving average on 200 years of exchange data revealed that the reward-to-risk ratios in all tests were high, averaging 15:1, and the average profit per trade was satisfactory at 48%. Unfortunately, the percentage of winning trades was very low, at 29%, making this strategy unprofitable overall.
Trading the Best Exponential Moving Average Settings: Tested
The EMA isn't the most reliable indicator, but my research shows that the best setting for the EMA indicator is a 20-day period on a Heikin Ashi chart. This setting is the only one that outperforms a buy-and-hold strategy with an 83% win rate.
Elliott Wave Trading Exposed: Here’s Why To Avoid It
Proving the effectiveness of Elliott Wave theory is impossible since its principles are subjective and lack mathematical validation. From my testing, I strongly advise against using this indicator for stock trading.
5 Moving Average Indicators Tested on 43,770 Trades
I tested 43,770 trades to determine which ones are the best performers. The best moving average settings are SMA or EMA 20 on a daily chart, which achieves a 23% win rate.
Weighted Moving Average (WMA) Explained & Reliability Tested
My research reveals that the WMA underperforms other moving averages, with only a 7% win rate on a standard OHLC chart. However, using it on Heikin Ashi charts produces excellent results.
Top 10 Best Bullish Patterns Tested & Proven Reliable
My research indicates that the most reliable and accurate bullish patterns are the cup-and-handle, with a 95% bullish success rate, the head-and-shoulders (89%), the double-bottom (88%), and the triple-bottom (87%).
12 Accurate Chart Patterns Proven Profitable & Reliable
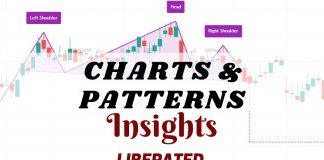
Research shows that the most reliable chart patterns are the Head and Shoulders, with an 89% success rate, the Double Bottom (88%), and the Triple Bottom and Descending Triangle (87%). The Rectangle Top is the most profitable, with an average win of 51%, followed by the Rectangle Bottom with 48%.
22 Best Stock Chart Patterns Proven Reliable By Data Testing
Published research shows the most reliable and profitable stock chart patterns are the inverse head and shoulders, double bottom, triple bottom, and descending triangle. Each has a proven success rate of over 85%, with an average gain of 43%.
How to Trade a Descending Triangle’s 87% Success Rate
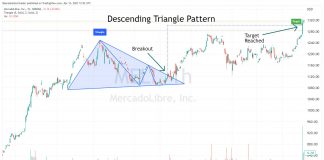
Twenty years of trading research show the descending triangle pattern has an 87% success rate in bull markets and an average profit potential of +38%.
How to Trade a Cup and Handle’s 95% Reliability & 54%...
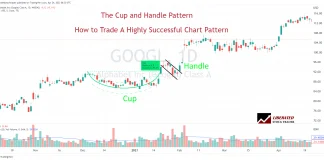
Twenty years of trading research show that the cup and handle pattern has a 95% success rate in bull markets and returns an average profit of +54%.
How to Trade the Inverse Head & Shoulders with 89% Accuracy
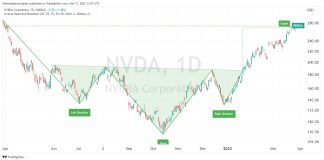
The inverse head and shoulders pattern is one of the most accurate technical analysis reversal patterns, with a reliability of 89%. It occurs when the price hits new lows on three separate occasions, with two lows forming the shoulders and the central trough forming the head.
How to Trade a Double Bottom Pattern’s 88% Success Rate
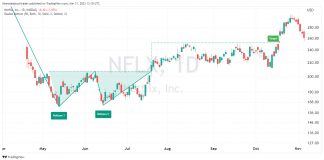
Decades of research reveal the double bottom pattern has an 88% success rate in bull markets and an average profit potential of +50%. The double-bottom chart pattern is one of the most reliable and accurate chart indicators in technical analysis.
How to Short-Sell an Inverse Cup and Handle’s 82% Reliability
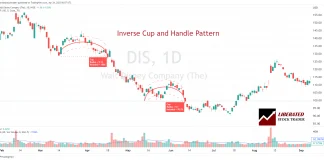
Two decades of trading research indicate that the inverse cup and handle pattern has an 82% success rate and average price drops of 17%. It is an ideal pattern for short-selling.
Why Traders Should Avoid Using Bull Pennant Chart Patterns
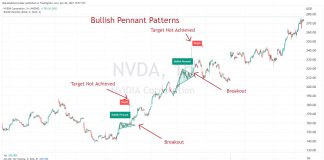
Traders must be cautious when using bull pennant chart patterns. Published research reveals a low success rate of 54% and a meager price increase of 7%.


