The mean reversion trading strategy suggests that prices and returns tend to revert to their mean or average over time.
I conducted over 120,000 test trades on five key mean reversion indicators: Stochastics, RSI, Commodities Channel Index, MACD, and Bollinger Bands. Each indicator varies in reliability and profitability.
This article is packed with videos and data that demonstrate how to trade these indicators in a mean-reversion strategy.
Key Takeaways
- Mean reversion suggests prices return to an average over time.
- There are five key technical indicators essential in mean reversion trading.
- Bollinger Bands, Stochastics, and the Commoditity Channel Index are highly effective indicators.

Implementing a mean reversion strategy involves identifying potential turning points in asset prices and entering trades anticipating a move back to the average.
Technical indicators play a pivotal role in this strategy, enabling traders to make informed decisions. Successfully applying mean reversion requires a deep understanding of market forces, a robust trading plan, and adapting strategies to suit changing market conditions.
Understanding Mean Reversion
Mean reversion is a theory that traders use to craft a strategy based on the assumption that an asset price will tend to return to its historical mean or average over time. This core tenet supports various trading strategies that hinge on the expectation of price normalization.
In essence, mean reversion suggests that prices will fluctuate around a true average, implying a state of equilibrium that is normal for the asset. Traders leverage this concept to identify potential reversals in price trends. When prices deviate significantly from the mean, these traders anticipate a reversion to the mean, potentially earning profits as prices return to their average.
Deviation from the mean is usually measured using statistical tools, which signal whether an asset is under- or overvalued based on historical data. The mean reversion strategy posits that high deviations are not sustained indefinitely, and prices will eventually revert to their long-term mean.
It is worth noting that mean reversion applies more to certain types of assets and market conditions than others. For example, it’s often seen in well-established markets where historical data provides a reliable average.
Mean reversion trading strategies rely on the assumption that prices will eventually revert to their historical mean. This approach often looks for situations with a significant deviation from average prices, believing that overbought or oversold conditions can signal opportunities for a prospective correction.
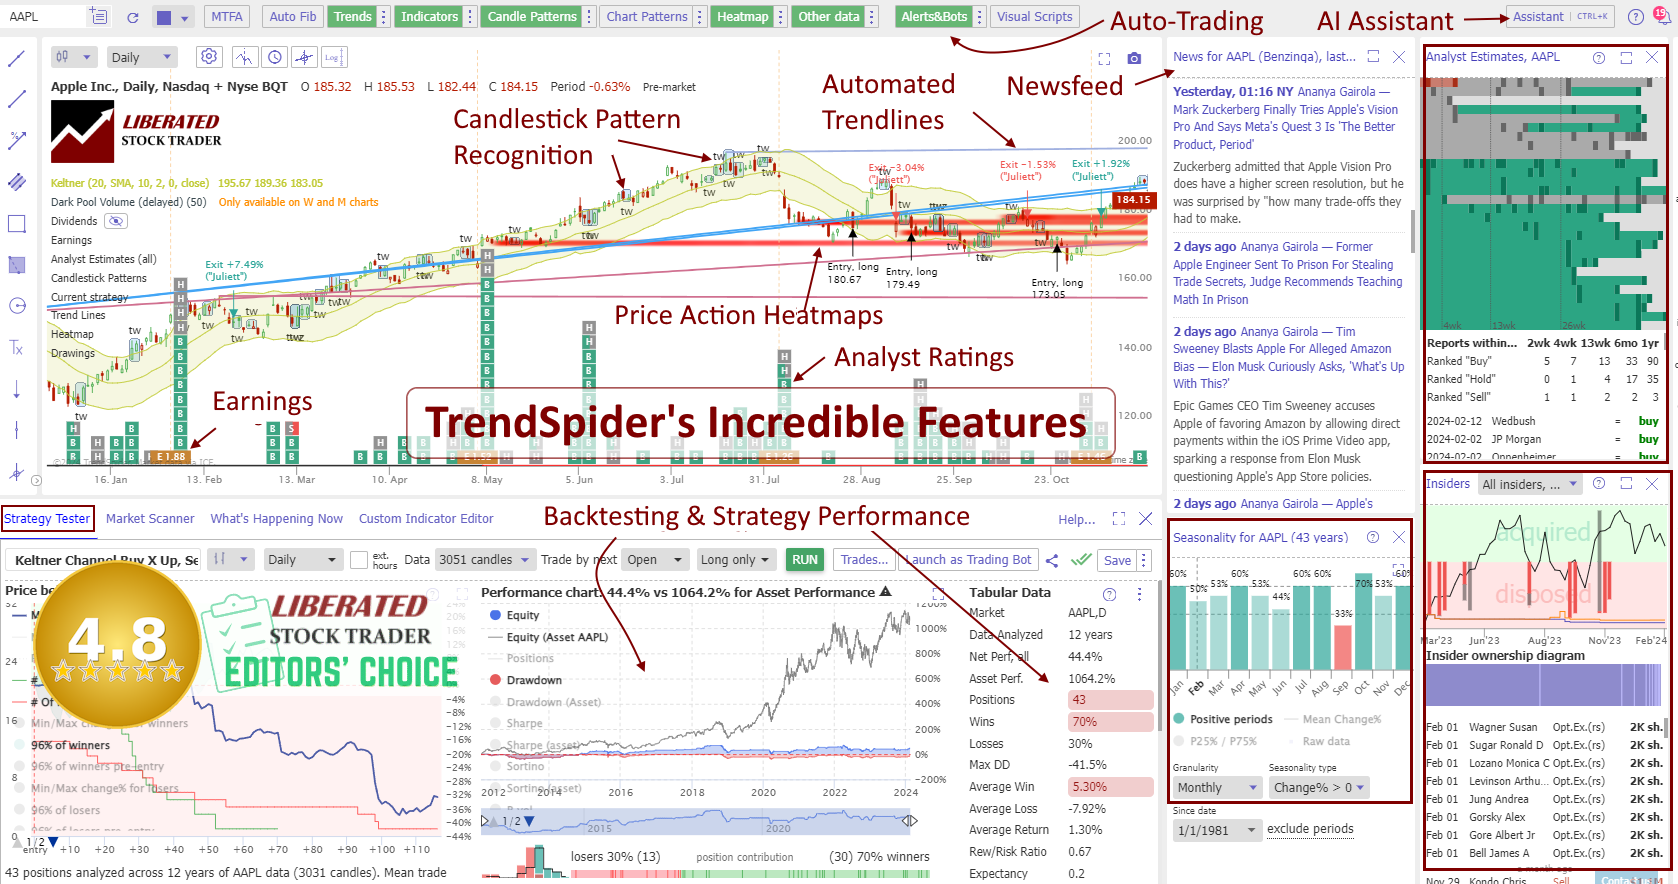
TrendSpider 4.8/5⭐: My Pick for AI-Power & Auto-Trading
I’ve used TrendSpider for 7 years for my research and testing. It auto-detects trendlines, patterns, and candlesticks, backtests ideas, and lets you use AI to create unique strategies and launch trading bots—with no code.
☆ 45% Discounts on Advanced, Elite & Premium Plans ☆
Unleash Pure AI, Auto-Trading & Industry Leading Trade Automation
Deal Ends In:
Top 5 Mean Reversion Indicators
Mean reversion trading relies on statistical phenomena where prices revert to an average over time. Technical indicators are tools that traders use to identify such opportunities. These indicators can signal when an asset is deviating from its historical average, suggesting a potential reversion is imminent.
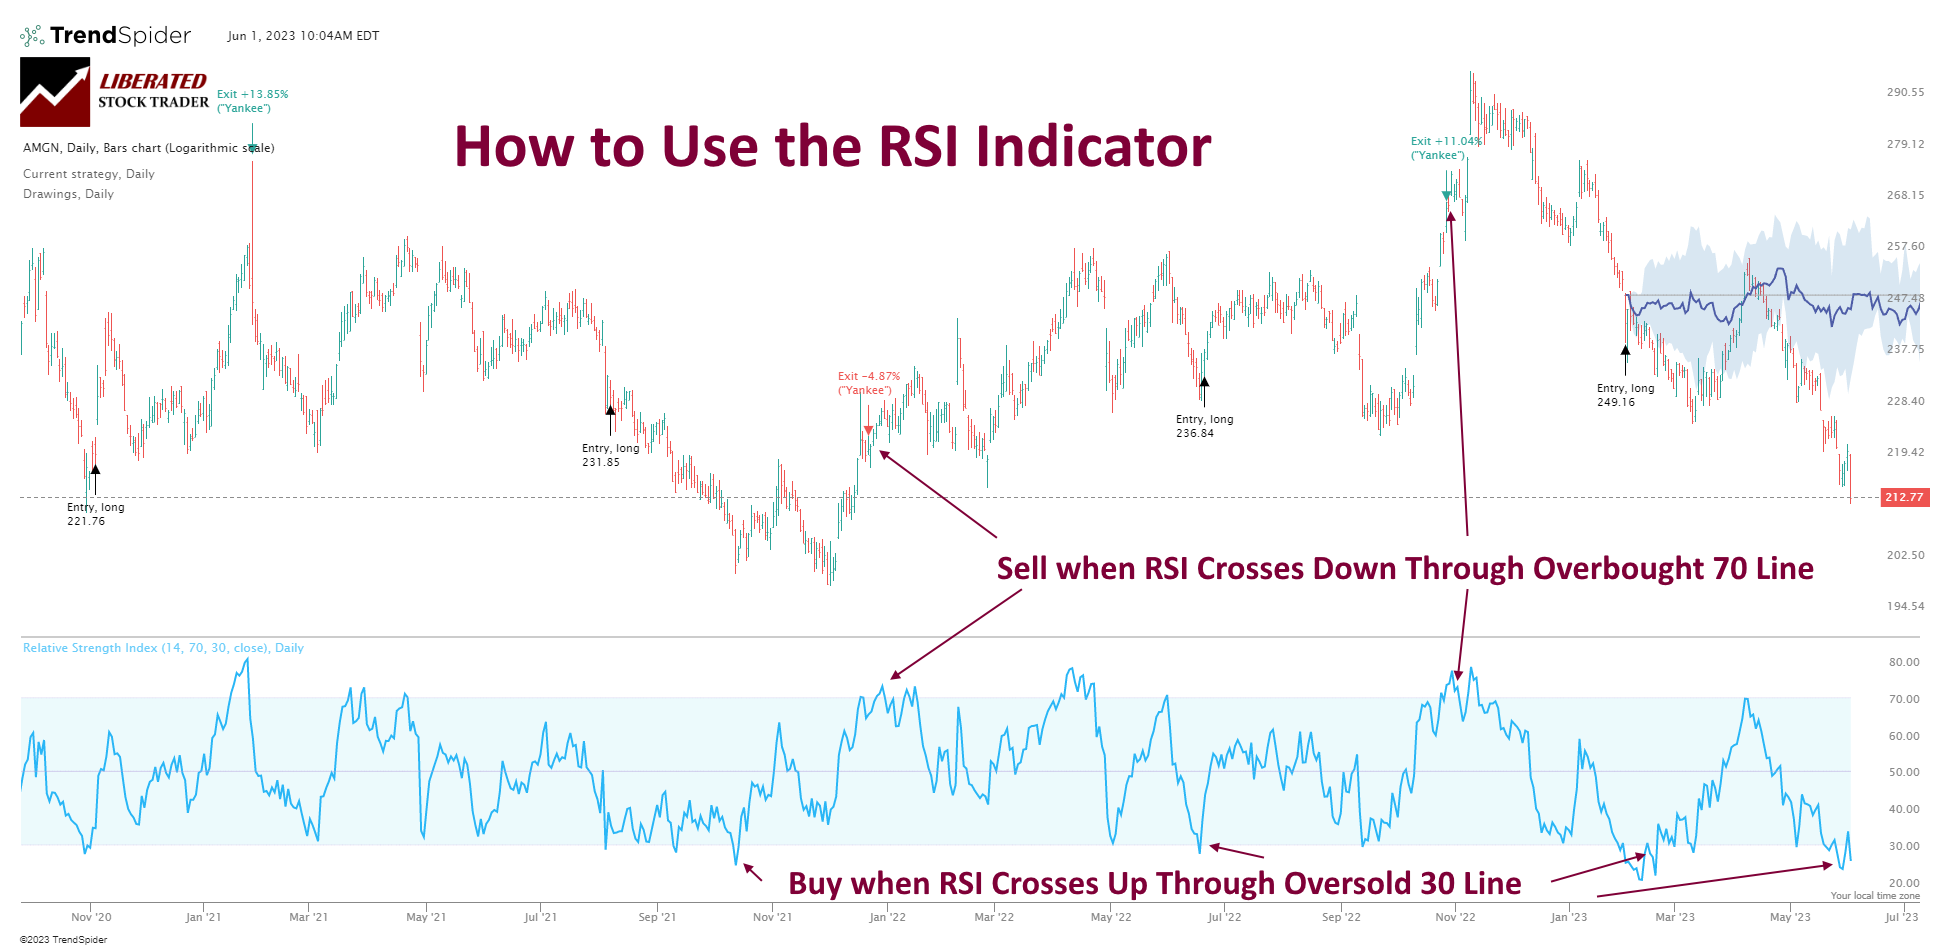
1. Relative Strength Index (RSI)
The Relative Strength Index (RSI) is a momentum oscillator that measures the speed and change of price movements. The RSI oscillates between zero and 100. Typically, an RSI above 70 indicates an asset may be overbought, while an RSI below 30 might be oversold. These conditions indicate that a potential mean reversion may occur.
For example, to trade using the Relative Strength Index (RSI) indicator, traders will look for buy and sell signals based on the value of the RSI oscillator. When the RSI exceeds 70, it indicates an overbought market, meaning price increases may slow down and reverse. The typical trigger for selling an asset is the RSI line crossing down through the 70 mark.
2. Bollinger Bands
Bollinger Bands consist of a middle band, a simple moving average (SMA) flanked by two standard deviation lines. They expand, contract with volatility, and prices bounce back to the middle band after touching the outer bands. This behavior makes them useful for mean reversion strategies.
Bollinger Bands can be used in various ways to identify trading opportunities. Traders often use the distance between the outer bands to measure volatility and look for potential trade entry points. If prices move outside of the indicator’s upper or lower limits, it could signal that the price is either overbought or oversold, and a trader could take advantage of these situations.
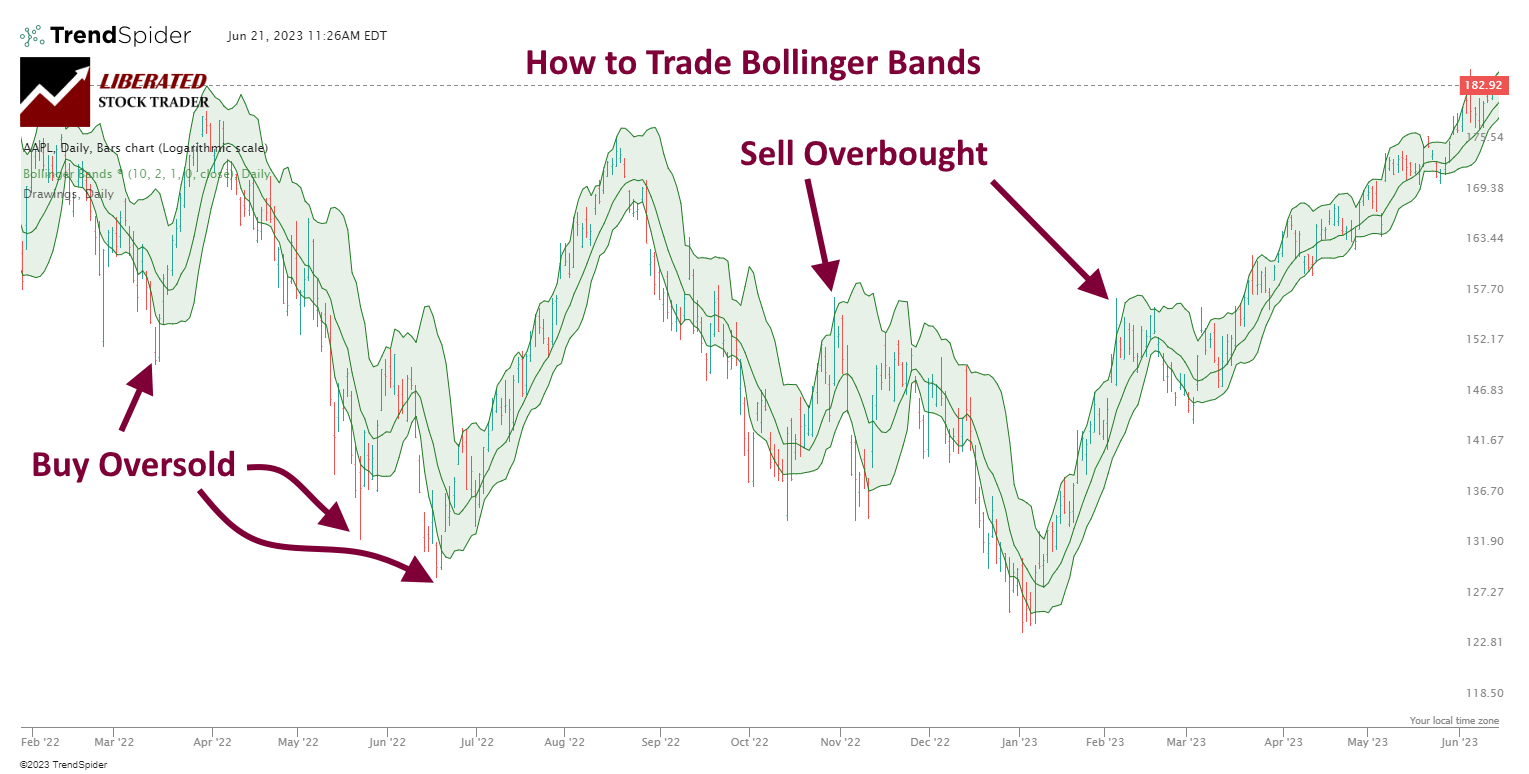
One popular way to trade Bollinger Bands is to buy when the price crosses above the lower band and sell when it crosses below the upper band. This strategy works best in trending markets, as it will help traders capture larger gains from long-term trends.
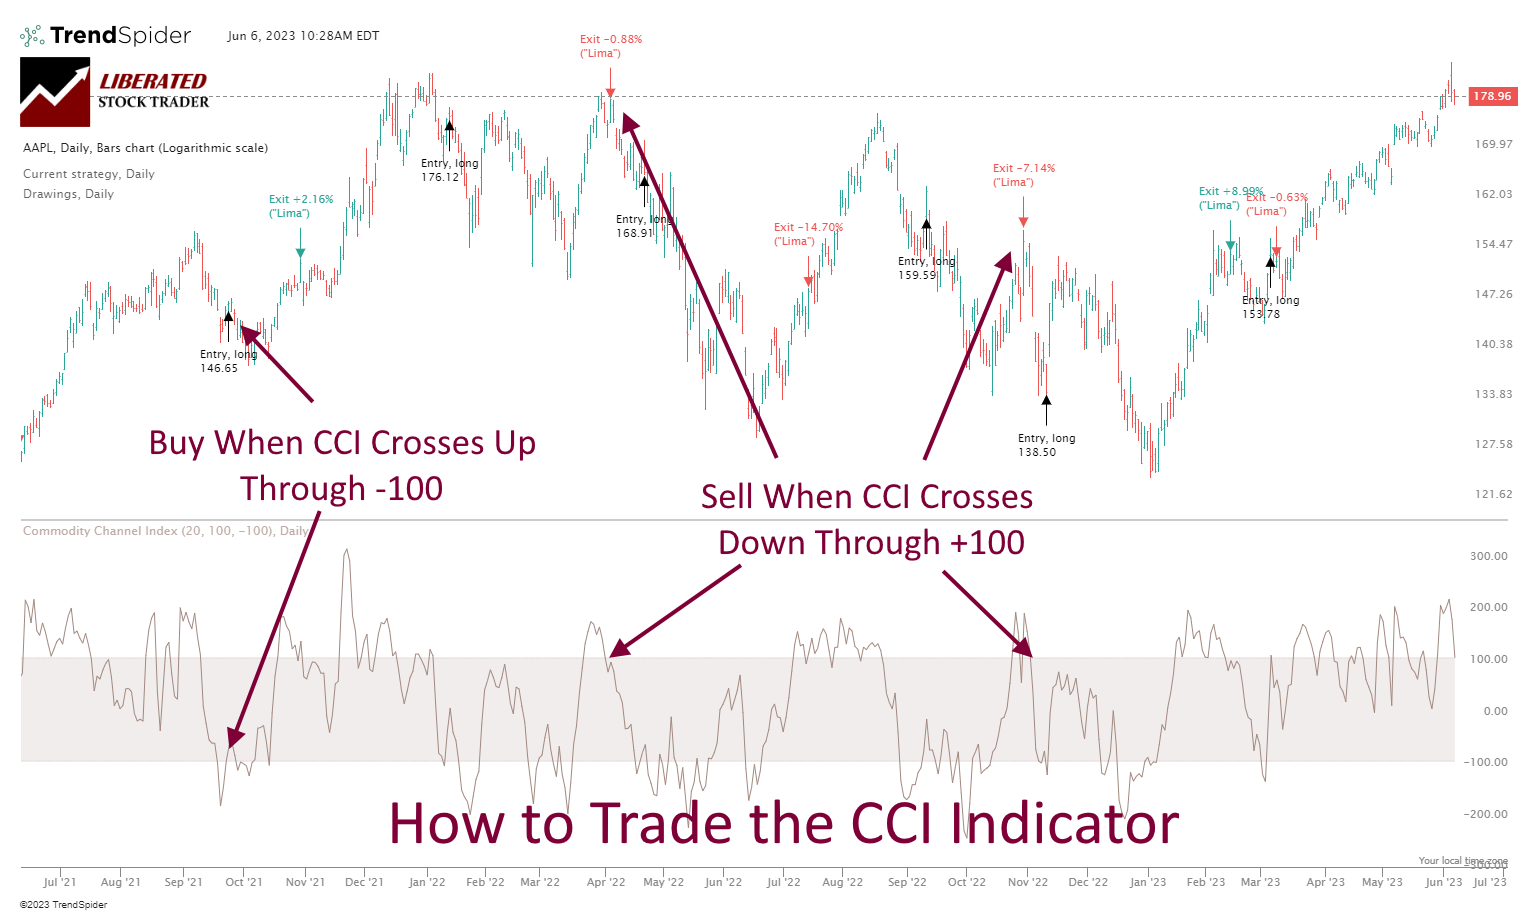
3. Commodity Channel Index
Based on 43,297 test trades, my research shows the Commodity Channel Index (CCI) is a profitable momentum indicator used to identify overbought and oversold conditions. It measures the strength of trends and volatility in stocks, commodities, and indices.
My testing demonstrates that the Commodity Channel Index (CCI) is a reliable and profitable technical analysis indicator yielding up to 85% win rates when used with the correct settings.
Much is written about the best way to trade the Commodity Channel Index, but my testing shows only one profitable strategy. The proven way to trade the CCI indicator is to buy when it moves above -100 after dipping below it and sell when it moves back below +100 after rising above it.
4. Stochastic Oscillator
The Stochastic Oscillator is a technical analysis tool that compares a security’s closing price to its price range over a specific period. It generates values between 0 and 100, helping traders identify overbought and oversold conditions. Readings above 80 suggest that the asset might start declining toward the mean, while readings below 20 indicate a potential upward mean reversion.
My backtested Stochastic Oscillator research on 1-, 5-, and 60-minute, as well as daily, charts across the DJ30 stocks over 12 years, totaling over 399 years of testing data, reveals mixed success rates.
On standard charts, the Stochastic Oscillator is not profitable in all timeframes. However, I did discover the most profitable settings for the Stochastic Oscillator in trading.
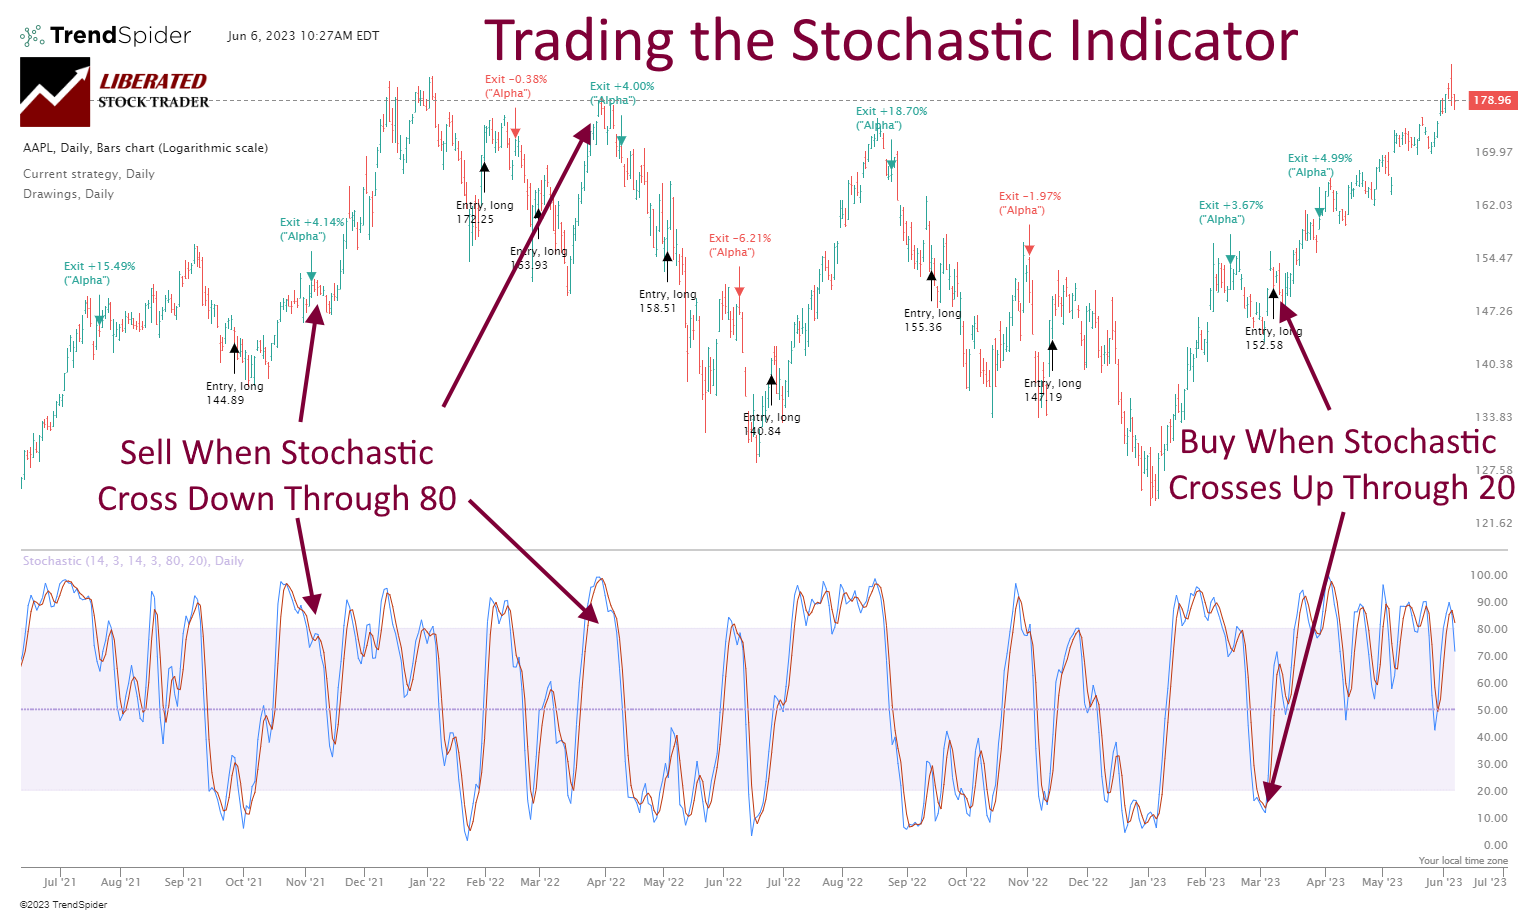
One way to trade stochastic is a crossover strategy. This involves looking for a crossover between two lines (K line and D line). When the K line crosses above the D line, this is a signal to go long; when the K line crosses below the D line, this is a signal to go short.
5. MACD
A commonly used toolkit in the mean reversion strategy is the Moving Average Convergence Divergence (MACD). This technical indicator helps identify the momentum and potential mean reversion points by assessing the relationship between two moving averages of a stock’s price. Traders might enter a position when the MACD line crosses above the signal line for a potential uptrend and sell when it crosses below, signaling a downturn towards the mean.
Moving Averages are instrumental in mean reversion trading as they establish an average price over a specific period. Simple moving averages (SMA) are commonly used for this purpose. When prices deviate significantly from the SMA, it often indicates a price anomaly that may revert to the mean.
After testing 43,770 trades to find the top performers, I found that the best moving average settings are SMA or EMA 20 on a daily chart, achieving a 23% win rate. For settings of 50, 100, and 200, the Hull moving average performs better, with win rates of 27%, 10%, and 17%, respectively.
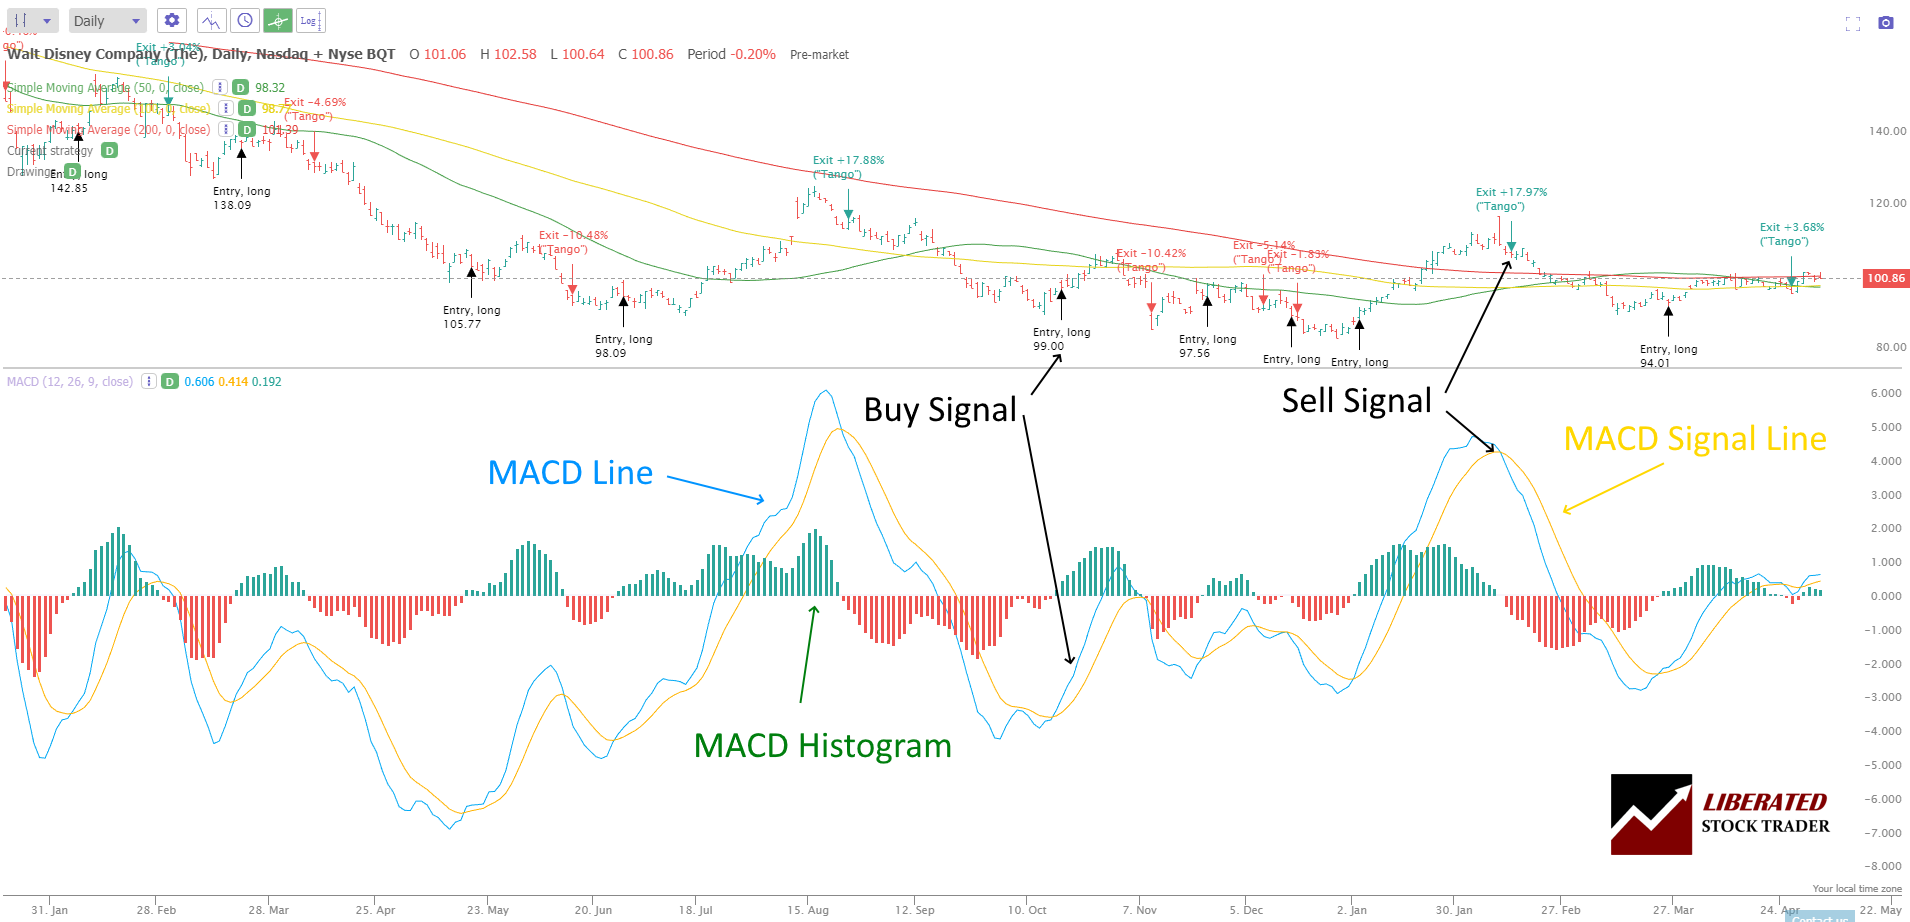
To read a MACD chart, look for the point at which the MACD line crosses above or below the signal line. This point of intersection indicates a buy or sell signal, respectively. Additionally, when the MACD histogram is above zero, it may indicate an uptrend, while a value below zero could indicate a downtrend. Furthermore, identifying divergences between the MACD and price action could strongly indicate an upcoming change in momentum.
Crafting a Mean Reversion Strategy
Crafting an effective mean reversion trading strategy involves meticulously selecting assets and timeframes, establishing strict risk management rules, and defining precise entry and exit points to capture profit potential while minimizing losses.
Selection of Timeframe and Assets
Mean reversion trading strategies perform optimally on certain timeframes and assets. Traders need to identify stocks that exhibit mean reversion characteristics, typically through statistical analysis of historical price movements. Selecting the right timeframe is pivotal, as shorter timeframes may offer more trading opportunities but with increased noise, while longer ones may provide clearer signals at the expense of frequency. Utilizing moving averages can assist in determining the mean level around which a stock price oscillates.
- Timeframe: Intraday, daily, weekly
- Assets: Stocks well-known for mean reversion patterns
- Indicators: Moving averages (e.g., 20-day, 50-day)
Risk Management and Rules
Effective risk management is crucial in any trading strategy; mean reversion trading is no exception. Traders should define and adhere to stringent risk management rules to protect their capital. This can include setting stop-loss orders beyond the typical fluctuation range or a certain percentage from the entry point. Additionally, using options for hedging can provide a safety net for positions trending unfavorably.
- Risk per trade: 1-2% of total capital
- Stop-loss: Set beyond support and resistance levels
- Hedging: Options can be used to limit downside risk
Entry and Exit Strategies
Identifying the optimal entry and exit strategies is key to success for mean reversion traders. Entry points are often determined when prices deviate significantly from the average—these points can be recognized using statistical tools such as standard deviation bands around the moving average. Traders may take a position opposite to the current trend (buying on weakness or shorting on strength), anticipating that prices will revert to the mean. As for exits, they may aim to take profit at the mean level or utilize trailing stops to capture additional upside while protecting gains.
- Entry: Buy or short when the price deviates excessively from the moving average
- Exit: Take profit at reversion to mean or employ trailing stops
In mean reversion trading, thorough strategy planning and disciplined execution are essential. By focusing on asset selection, risk control, and precise entry and exit points, traders can strive to capture the profit potential that this approach to the markets offers.
Price Deviation and Historical Mean
Price deviation refers to the extent to which an asset’s price has moved away from its historical mean. Traders utilize support, resistance levels, and historical price averages to identify potential entry and exit points. When security is oversold, it has moved substantially below its historical mean, whereas an overbought condition suggests the opposite. A reversion strategy posits that these deviations are temporary, and a correction towards the mean is likely.
Market Conditions and Asset Behavior
Market conditions greatly impact the effectiveness of mean reversion trading. In stable market environments, assets follow a standard deviation from the mean, with prices oscillating within a predictable range. Traders should assess the prevailing market conditions, considering whether they are conducive to the strategies applied for mean reversion trading. Market behavior analysis helps in predicting the likelihood of a reversion.
The Role of Volatility in Mean Reversion
Volatility is critical in assessing a mean reversion strategy’s risk and potential reward. High volatility often leads to larger price deviations, implying a greater potential for reversion. However, it also increases the level of risk associated with the trade. Calculating the volatility using statistical measures like standard deviation helps traders gauge the probability of mean reversion and manage risk more effectively.
Example Strategies
Mean reversion strategies assume prices and returns eventually return to the mean or average. This section outlines practical examples of traders utilizing mean reversion in various trading strategies.
Pairs Trading
Pairs trading is a market-neutral strategy that involves identifying two co-integrated stocks and trading on the relative change in their spread. When the spread between the stocks widens, a trader would short the outperforming stock and long the underperforming one, betting on their eventual convergence. For example, if two automobile companies historically move in tandem and a divergence is detected due to temporary fluctuations, a trader might execute a pair trade to capitalize on the expected mean reversion.
Pros
- High Probability Trades: Trades based on mean reversion can offer a higher success rate, as assets tend to return to their historical average, potentially leading to consistent profits.
- Defined Entry and Exit Points: Traders often have clear entry and exit criteria, reducing ambiguity in decision-making.
- Favorable for Range-bound Markets: Mean reversion is particularly effective in markets that are not trending strongly and where prices oscillate within a range.
Cons
- False Signals: Sometimes, what appears as a temporary deviation can be the start of a new trend, leading to false signals and potential losses.
- Requires Strict Discipline: To manage risks effectively, traders must adhere strictly to stop-losses and take-profit levels.
- Market Sensitivity: Rapid changes in the market environment or conditions can significantly affect the effectiveness of mean reversion strategies.
Applying Mean Reversion in Various Markets
Mean reversion trading strategies hinge on the principle that asset prices tend to revert to their long-term average. Investors across various markets apply this concept to gauge potential entry and exit points, aiming to capitalize on price anomalies for profit while navigating risks associated with fluctuations.
Stocks and Options
In the stock market, mean reversion informs trading decisions by indicating when stocks deviate significantly from their historical averages. For example, investors might anticipate a pullback if a stock’s price soars well above its 200-day moving average. Options traders can leverage mean reversion through strategies that profit from decreased volatility, often after prices have moved dramatically and may be due to reverting.
Commodities
The strategy focuses on cyclical price changes influenced by supply and demand dynamics when dealing with commodities. Mean reversion can be valuable in these markets as certain commodities exhibit seasonality or are influenced by predictable economic cycles. Investors might track prices like crude oil or wheat against long-term commodity indexes to identify trading opportunities.
Interest Rate Markets
Finally, interest rate markets rely heavily on mean reversion due to the cyclical nature of rates. Investors monitor interest rates alongside economic indicators to predict movements in bond prices. In day trading, which focuses on more immediate fluctuations, mean reversion can hint at when rates are poised to normalize following economic news or policy announcements affecting financial markets.
Algorithmic Trading Strategies
Algorithmic trading strategies leverage computer programs to execute trades based on predefined criteria, which can efficiently exploit mean reversion in markets. Strategy optimization involves backtesting algorithms against historical data to confirm the strategy’s efficacy. These strategies often benefit from including technical indicators, such as moving averages or the Relative Strength Index (RSI), to identify potential mean reversion opportunities.
For instance, an algorithm might be programmed to buy assets when their price falls below the long-term average, signaling a potential mean reversion scenario. Additionally, adjustments are regularly made to directional markets where mean reversion may play out differently than in range-bound markets.
| Component | Description | Application |
|---|---|---|
| Backtesting | Evaluation of strategy against past data | Refinement of buy/sell rules |
| Indicators | Technical tools (e.g., RSI) | Signal generation |
| Market Conditions | Directional or volatile | Algorithm calibration |
By running these algorithms, traders can minimize emotional decision-making and exploit market inefficiencies more precisely.
FAQ
How can mean reversion strategies be applied in day trading for optimal results?
Mean reversion strategies in day trading often involve short-term entries and exits. Traders look for extreme deviations from a moving average or other statistical measure and then trade in anticipation of prices returning to that average.
What are the key indicators that identify potential mean reversion opportunities?
Key indicators for spotting mean reversion scenarios include statistical tools such as the Bollinger Bands, RSI, and moving averages. When prices stretch far from these indicators, it may signal a mean reversion opportunity.
How does mean reversion compare to trend following in terms of potential profits and risks?
Mean reversion and trend following are distinct approaches. While mean reversion profits from price corrections, trend following seeks to capitalize on longer-term momentum. Typically, mean reversion may offer quicker, smaller trades, whereas trend following aims for larger gains over a more extended period, potentially involving higher risks.
Can you provide a successful case study of a mean reversion trading strategy?
A successful case study might detail a scenario where a trader uses an oversold RSI signal on a stock that's trading significantly below its historical average price, purchasing the stock and selling it once it reverts to mean securing a profit.
What techniques in Python are used to develop an automated mean reversion trading strategy?
Python can be utilized for creating mean reversion strategies by applying libraries like pandas for data analysis and matplotlib for visualization to identify mean reversion moments. Additionally, backtesting frameworks like Backtrader are used to test strategies against historical data.
Are options spreads a viable method for capitalizing on mean reversion, and if so, how?
Options spreads can be viable for mean reversion trading, as they allow traders to set up positions that benefit from price stability or mild reversals. They can use strategies like the Iron Condor, which capitalizes on a stock remaining within a certain price range.