The Volume Weighted Average Price (VWAP) is an innovative indicator that combines price and volume to provide a weighted average price.
My testing shows that VWAP is not a reliable indicator on a standard candle or OHLC chart. In contrast, using VWAP on a Heikin-Ashi chart proves very profitable and offers a distinct trading advantage.
Day trading settings: On a 5-min, 68-day test, pairing VWAP with Heikin-Ashihi crushed the Japanese candlestick chart across the board: it beat the market 93% of days vs 30%, lifted win rate 29% vs 20%, and kept a similar payoff (R/R 4.1 vs 4.0) while firing ~24% fewer trades (130 vs 170).
Key Takeaways
- VWAP combines price and volume to provide a weighted average price.
- It’s useful for identifying potential buy and sell points during the trading day.
- VWAP is not profitable on standard candlestick or OHLC charts.
- VWAP is incredibly reliable on Heikin Ashi charts, according to my testing.
- VWAP has limitations and must be applied with an understanding of underlying market conditions.
Understanding VWAP
To calculate the VWAP, the cumulative tally of the product of volume traded and the trade price is divided by the total shares traded over a particular time frame, often standardized to one trading day.
This calculation gives the VWAP a unique position among trading indicators because it considers the price and volume. Traders often use VWAP to assess the market, plan entry and exit points, and confirm the strength of market trends.
For trading, the importance of VWAP lies in its ability to provide a real-time snapshot of price levels relative to the volume-weighted average. It’s a practical tool for:
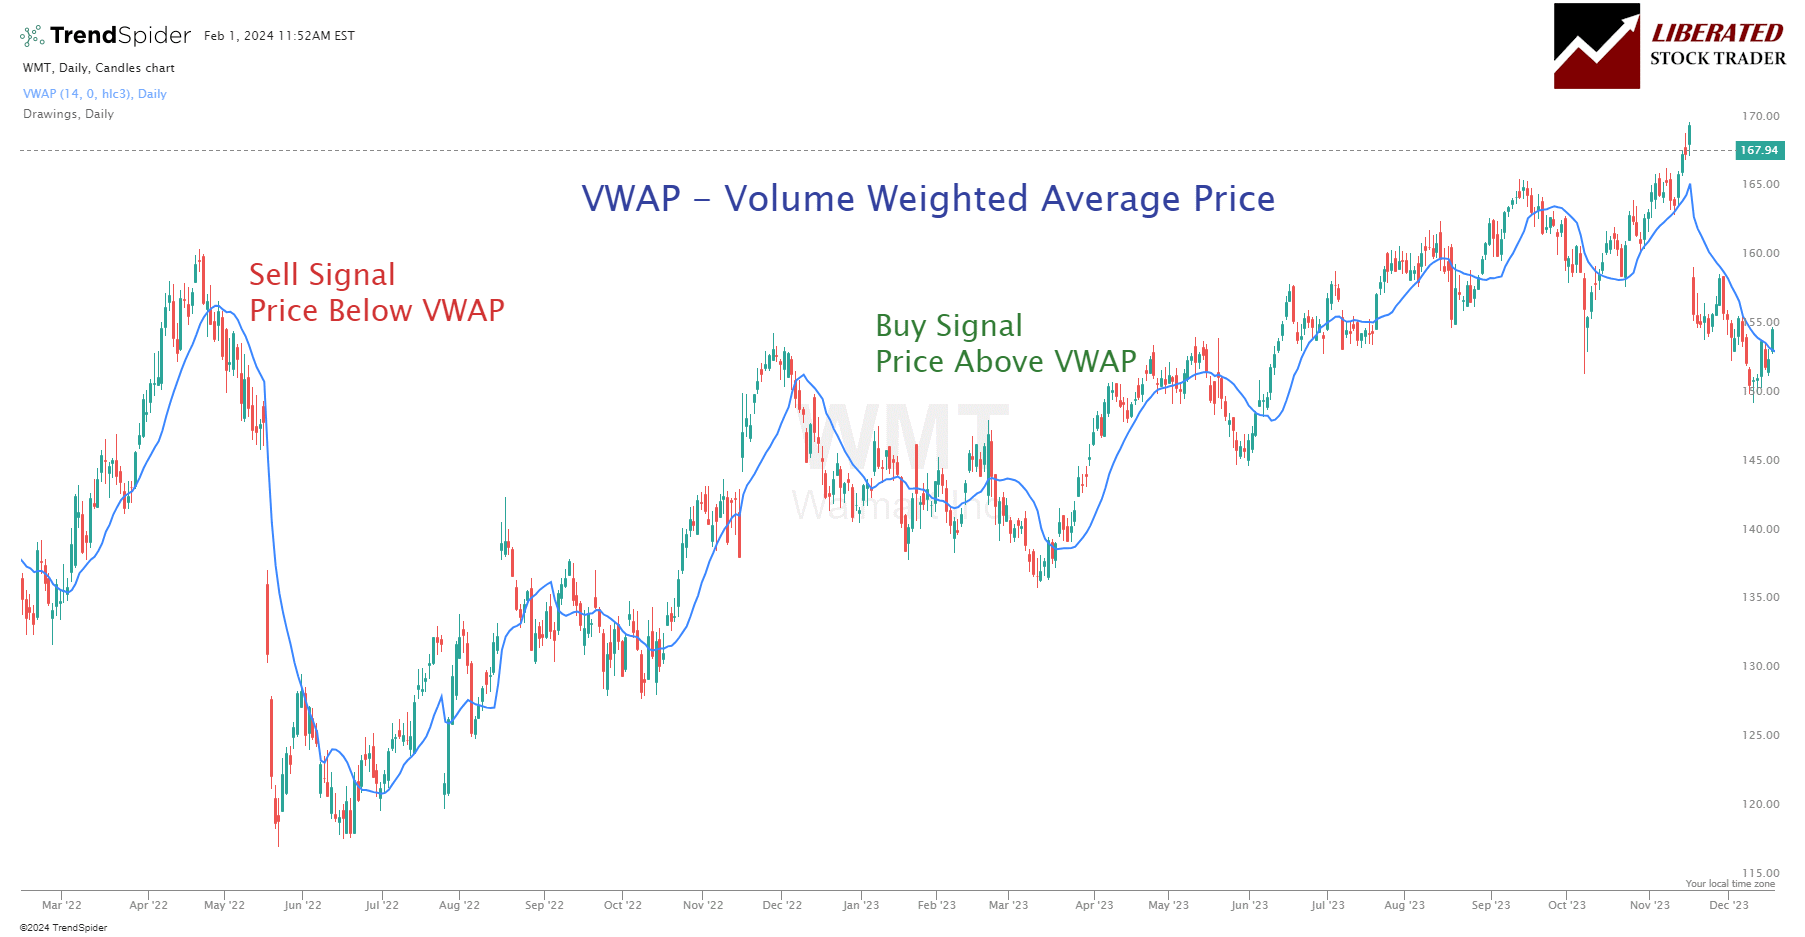
- Trend identification: You can identify the trend by comparing the current price to the VWAP. Prices above VWAP may indicate a bullish trend, while prices below VWAP may suggest a bearish trend.
- Order execution: Institutional traders often use VWAP to help judge if a security is overpriced or underpriced and thus make informed decisions for order execution. It is a useful indicator for short-term traders who capitalize on rapid market movements.
Day traders and short-term traders rely on VWAP to make strategic entry and exit points. While technical analysis uses many indicators, VWAP stands out for its incorporation of price and volume, offering a dynamic understanding of market sentiment.
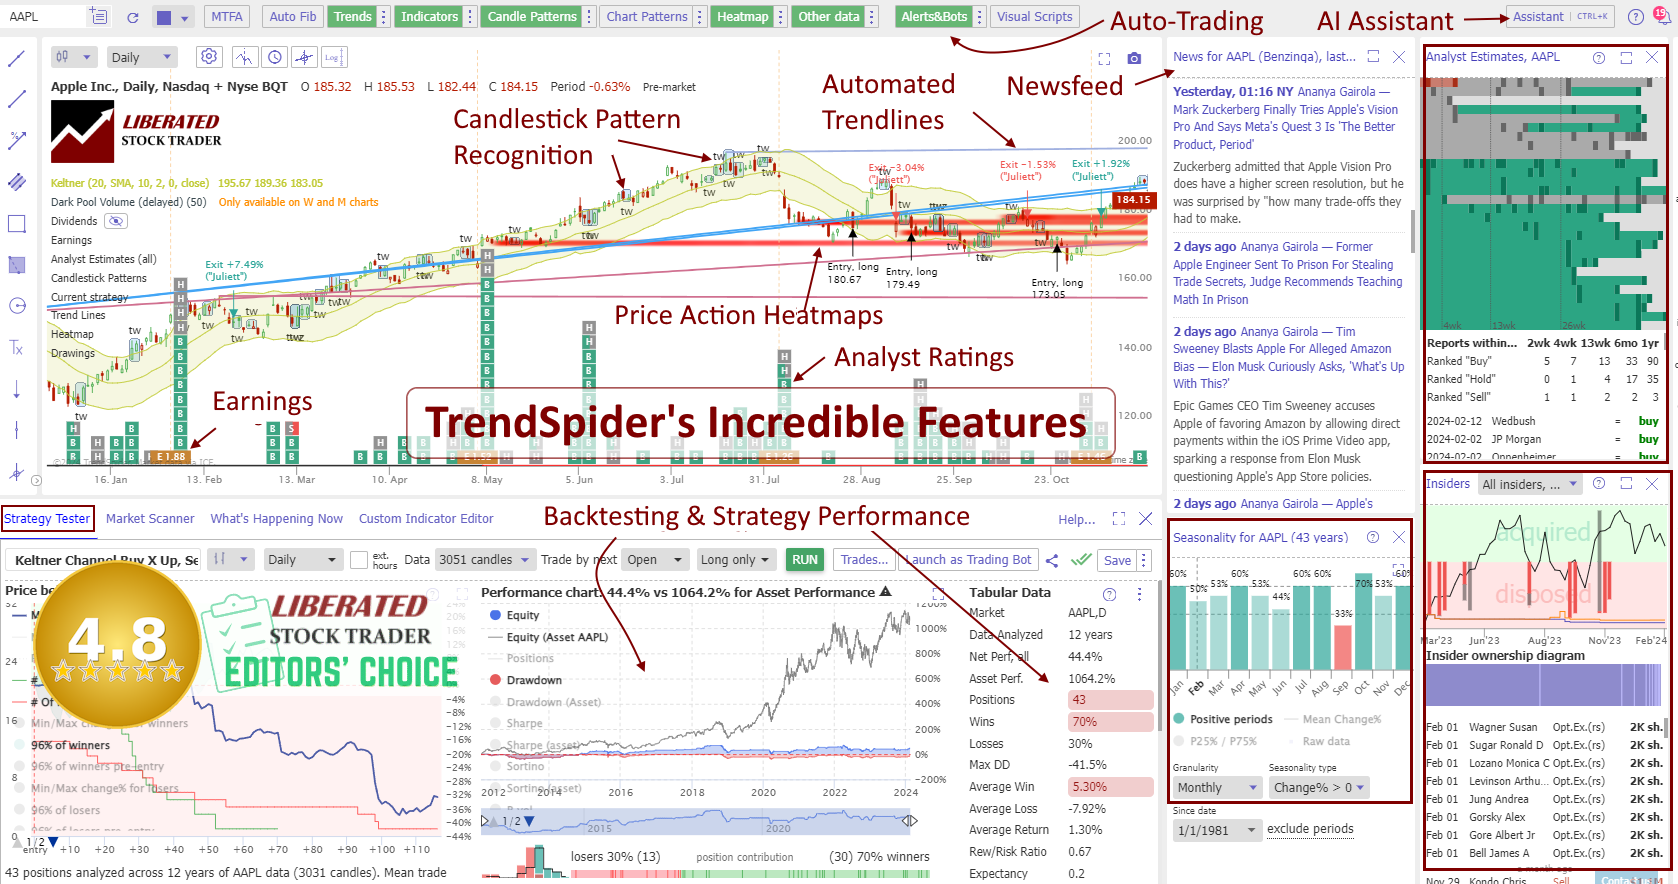
TrendSpider 4.8/5⭐: My Pick for AI-Power & Auto-Trading
I’ve used TrendSpider for 7 years for my research and testing. It auto-detects trendlines, patterns, and candlesticks, backtests ideas, and lets you use AI to create unique strategies and launch trading bots—with no code.
☆ 45% Discounts on Advanced, Elite & Premium Plans ☆
Unleash Pure AI, Auto-Trading & Industry Leading Trade Automation
Deal Ends In:
✩ How I Set Up VWAP Backtesting ✩
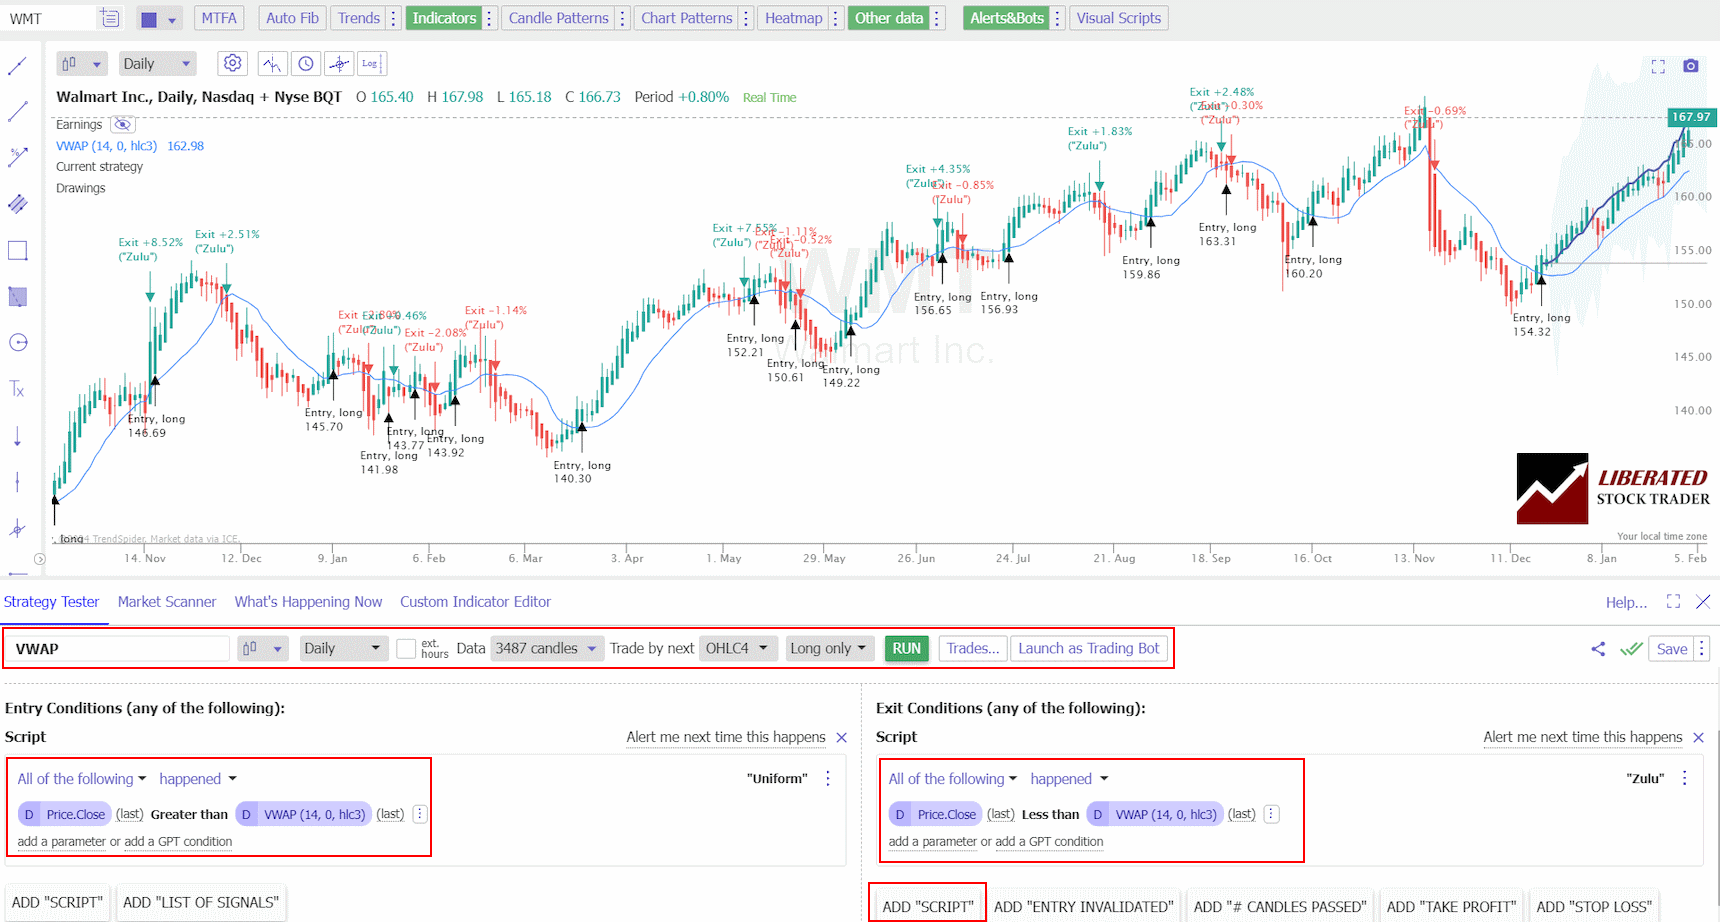
To set up VWAP backtesting strategies to enable a scientific approach to prove this indicator’s effectiveness, I used TrendSpider. I ran four tests:
- A 5-minute timeframe on an OHLC/Candlestick chart (for day trading)
- A daily timeframe on an OHLC/Candlestick chart (for swing trading)
- A 5-minute timeframe on a Heikin Ashi chart (for day trading)
- A daily timeframe on a Heikin Ashi chart (for swing trading)
To reproduce these tests, follow these steps.
VWAP Trading Strategy Setup
- Register for TrendSpider.
- Buy Signal: Select Strategy Tester > Entry Condition > Add Script > Add Parameter > Condition > Price. Close > Greater than > VWAP (14).
- Sell Signal: Exit Condition > Add Script > Add Parameter > Condition > Price. Close > Less than > VWAP (14).
- Select the timeframe and chart time (in the lower pane).
- Finally, click “RUN.”
See the image below for the exact configuration.
Backtest Your Strategies on TrendSpider Now
✩ VWAP Day Trading Results ✩
I tested VWAP on the Dow Jones Industrial Average 30 stocks over a period of 68 days, encompassing 400 trades. The Volume Weighted Average Price (VWAP) indicator is not profitable for day traders when using a standard candlestick/OHLC chart, producing a 30% win rate. However, in combination with a Heikin Ashi chart, the indicator produces excellent rewards.
Using VWAP on a 5-minute day trading and a Heikin Ashi chart produced a superb win rate, outperforming 93% of stocks using a buy-and-hold strategy. Although the winning trades were only 29%, the 4.1 reward/risk ratio led to success on nearly every stock.
| VWAP Indicator Test | Candle Chart | Heikin Ashi Chart |
| Timeframe | 5-min | 5-min |
| Duration | 68 Days | 68 Days |
| % Beating Mkt | 30% | 93% |
| Avg # Trades | 170 | 130 |
| Reward/Risk Ratio | 4 | 4.1 |
| %Winners | 20% | 29% |
The VWAP indicator for day trading was set to 14 and tested across the DJ30 stocks for 68 days. Using a standard OHLC chart, the indicator produced a 30% success rate of beating a buy-and-hold strategy and a 4:1 reward-to-risk ratio. This strategy produced only 20% of winners, which is a losing strategy.
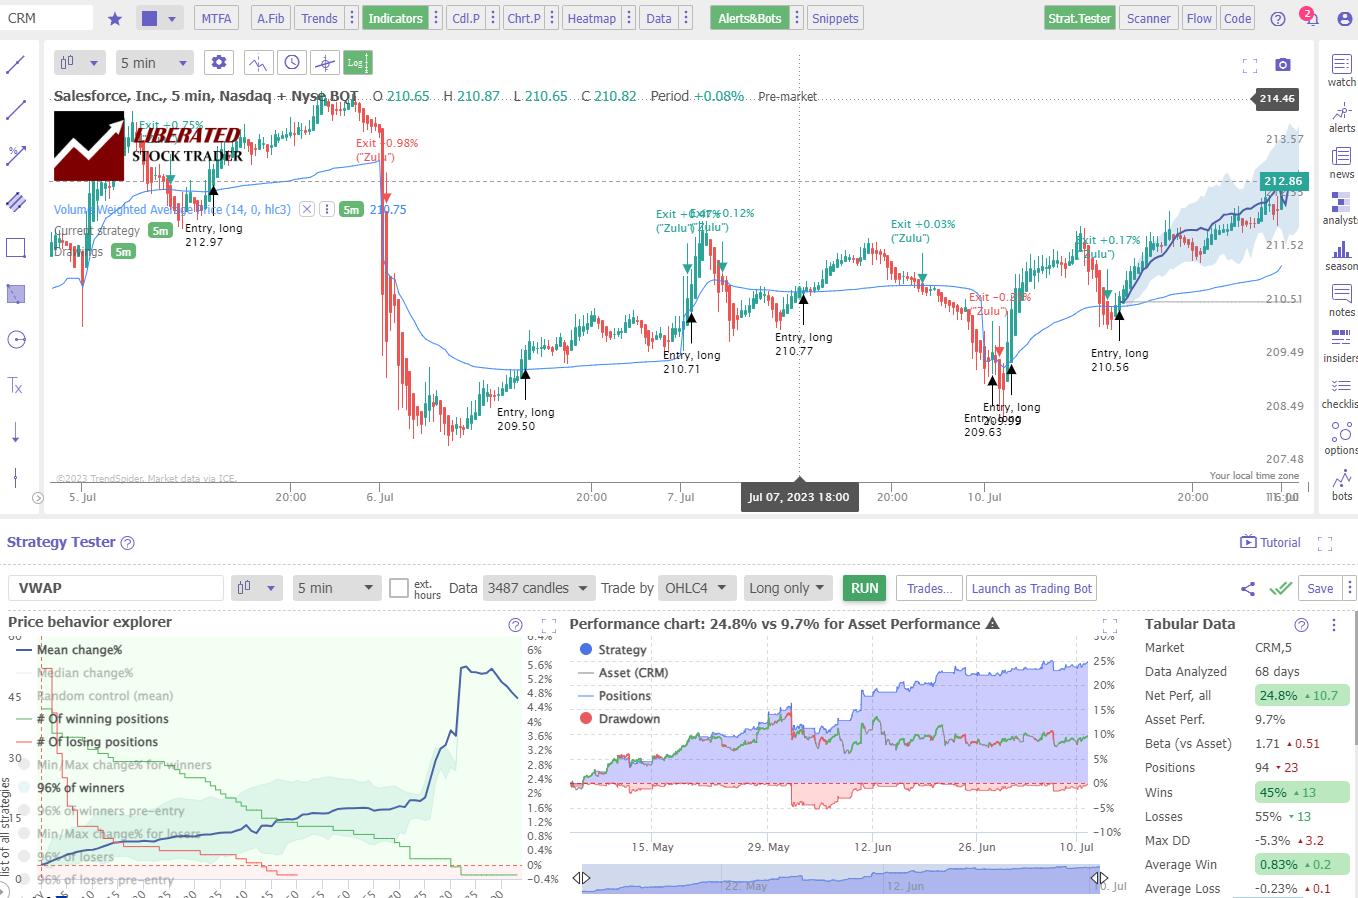
On a 5-min, 68-day test, pairing VWAP with Heikin Ashi crushed the candlestick version across the board: it beat the market 93% of days vs 30%, lifted win rate 29% vs 20%, and kept a similar payoff (R/R 4.1 vs 4.0) while firing ~24% fewer trades (130 vs 170).
Expectancy check (per trade): Candlesticks ≈ 0R (0.20×4 − 0.80×1), Heikin Ashi ≈ +0.48R (0.29×4.1 − 0.71×1).
Bottom line: VWAP on Heikin Ashi generates fewer but cleaner signals with a meaningful positive edge; the plain candlestick setup offers no net expectancy.
✩ VWAP Swing Trading Results ✩
Using VWAP with a 14 setting on a daily Heikin Ashi chart is vastly superior to conventional OHLC charts. Using an OHLC chart, the strategy barely breaks even with a low-profit expectancy of 0.15. In contrast with a Heikin Ashi chart, the strategy is incredibly profitable, with a profit expectation of 0.83 and a reward-to-risk ratio of 3.03.
This test used VWAP(14) on the Dow Jones Industrial Average 30 stocks over a period of 403 years, encompassing 13,381 trades.
The superior test results are highlighted in green below.
| VWAP Test Results | Daily OHLC Chart | Daily Heikin Ashi Chart |
| # Trades | 7,389 | 5,992 |
| Wins | 38% | 46% |
| Losses | 62% | 54% |
| Max DD | -36% | -19% |
| Max DD (Asset) | -47% | -46% |
| Average Win | 4% | 4% |
| Average Loss | -2% | -1% |
| Average Return | 0% | 1% |
| Rew/Risk Ratio | 2.03 | 3.03 |
| Expectancy | 0.15 | 0.83 |
The table above provides the VWAP test results on a daily OHLC chart and a daily Heikin Ashi chart. Let’s compare the results to highlight how the VWAP on a Heikin Ashi chart is superior.
When using the daily OHLC chart, the VWAP strategy had a success rate of 38%, with 62% of the trades resulting in losses. The maximum drawdown (DD) was at -36%, indicating a significant loss potential. The average win was 4%, and the average loss was -2%, resulting in an average return of 0%.
In contrast, when using the daily Heikin Ashi chart, the VWAP strategy had a higher success rate of 46%, with 54% of trades resulting in losses. The maximum drawdown (DD) improved to -19%. Moreover, the average win remained at 4%, but the average loss decreased to -1%, resulting in a positive average return of 1%.
Notably, the reward-to-risk ratio was higher when using the Heikin Ashi chart, with a ratio of 3.03 compared to 2.03 on the OHLC chart. This indicates that the potential reward is greater than the risk when using the Heikin Ashi chart.
✩ VWAP Backtesting Results Summary ✩
The results demonstrate that the VWAP strategy on a Heikin Ashi chart outperforms the strategy on an OHLC chart. The Heikin Ashi chart provides a higher success rate, lower drawdown, and improved reward-to-risk ratio, making it a superior choice for implementing the VWAP or Supertrend indicator in day trading.
Trading Strategies
Integrating the VWAP into your strategies can enhance your analysis of support and resistance levels and refine your approach to market entry and exit points. VWAP helps you identify the balance point between supply and demand over a given timeframe, considering both price and trading volume.
Utilizing VWAP for Support and Resistance Levels
You can use VWAP to gauge market direction and identify potential support and resistance levels when trading. Support levels often form when the price falls toward the VWAP and then rises, suggesting demand is outstripping supply. Conversely, resistance levels may be indicated when the price reaches the VWAP and begins falling.
- Support Example: If the price is above the VWAP line and starts to approach it, you might consider this as a buying opportunity, seeing the VWAP as a support zone.
- Resistance Example: If the price is below the VWAP and rises to it, look for selling opportunities, treating the VWAP as a resistance area.
Trading with an awareness of these zones could help you manage risk by setting clear boundaries for stop losses or take profits.
Combining VWAP with Other Indicators
For a more comprehensive analysis, pair the VWAP with other indicators. Combining VWAP with moving averages such as the Exponential Moving Average (EMA) can validate trends. When the VWAP crosses above the EMA, it could indicate a trending market to the upside, suggesting a potential buy signal. If VWAP crosses below the EMA, the market may trend downwards, potentially serving as a sell signal.
- EMA Cross: Look for the EMA (50-day or 200-day typically) and VWAP cross points as significant trend indicators.
- Bollinger Bands: Apply Bollinger Bands, which consist of lines plotted two standard deviations (positive and negative) away from a simple moving average of the stock’s price. When the VWAP moves outside the Bollinger Bands, it could signify an overextended market and a possible reversal.
Utilizing these combinations allows you to sharpen your strategic approach, potentially bolstering your trading results with more layered, nuanced insights.
VWAP Breakout and Reversal Techniques
VWAP can serve as a guide for breakout and reversal trades. A breakout might be on the cards if the price moves sharply through the VWAP level with increased trading volume, suggesting a strong move away from the average price.
- Breakout Strategy: Enter a trade when you notice the price breaks the VWAP with conviction and substantial volume. This may indicate a move away from the average towards a new price range.
A reversal technique involves looking for signs that the trend is weakening and that the price will likely return to the mean.
- Reversal Strategy: Spot reversals when price extremes coincide with low trading volume, suggesting the move lacks commitment and may revert to the VWAP level.
Integrating these strategies into your trading plan can help capitalize on shifts in market sentiment, provide targeted entry and exit points, and balance risk with systematic decision-making.
Advanced VWAP Concepts
Volume-weighted Average Price (VWAP) is not just a simple indicator but can be adapted for more nuanced analysis. By leveraging additional concepts like Anchored VWAP, VWAP bands, and customization options, you can precisely refine your trading strategy.
Anchored VWAP and Its Significance
Anchored VWAP allows you to set the VWAP starting point at a specific event, which is significant to your analysis. Unlike the traditional VWAP, which resets at the opening of each trading day, the anchored VWAP can be placed on a specific date or time, allowing investors to assess the price-volume behavior since a notable market event.
- How to Anchor: In your charting platform, such as TradingView, select Anchored VWAP from the indicators list, then click on the significant event on the chart to set the anchor.
- Why It Matters: By anchoring the VWAP, you tailor the time frame to a period relevant to your trade, thereby providing a custom understanding of market sentiment based on volume-weighted price.
VWAP and Standard Deviation Bands
Standard deviation bands can be added to the VWAP to create a channel indicating potential support and resistance levels.
- Upper and Lower Bands: These bands are plotted above and below the VWAP at distances corresponding to standard deviations of price away from the average.
- Upper Band: This may act as a potential resistance level.
- Lower Band: This could indicate a potential level of support.
You gain insight into the market’s current volatility and price extremes by analyzing where the price is in relation to these bands on your chart.
Customizing VWAP Settings
Different trading styles may require different VWAP settings, which can be adjusted according to your needs.
- Time Frame: You can adjust the time frame—intraday, daily, weekly, etc.— to get relevant insights for your trade period.
- Source: The source of the VWAP calculation (e.g., close, high, low, open, or a combination thereof) can also be adjusted to match your trading approach.
It is critical to ensure that the style and source settings in your charting platform, like TradingView, match the specificity of your trading system, allowing for accuracy in your strategies.
Calculating VWAP
VWAP is calculated by multiplying the cumulative total of the price of each trade by the volume of that trade, then dividing by the total volume traded for the day.
In short, VWAP averages the price of an asset, weighted by its volume within a certain time frame.
VWAP Formula
VWAP is calculated using the formula:
VWAP = Cumulative (Typical Price * Volume) / Cumulative Volume
Here, the Typical Price for each period is determined by the formula:
Typical Price = (High + Low + Close) / 3
Step-by-Step Calculation
- Calculate the Typical Price: For each period (usually one minute), add the high, low, and closing prices, then divide by three.Typical Price = (High + Low + Close) / 3
- Multiply the Typical Price by the Period’s Volume: This gives you the value amount for that period.Value = Typical Price * Volume
- Keep a Running Total of the Volume: Add each period’s volume to the prior total as the day progresses. Cumulative volume = Previous Cumulative Volume + Current Period’s Volume
- Calculate the Cumulative TPV (Typical Price x Volume): Sum up the Value amounts from each period throughout the day. Cumulative TPV = Previous Cumulative TPV + Current Period’s Value
- Divide the Cumulative TPV by the Cumulative Volume: This gives you the VWAP for that specific point in the day. The calculation is continuous through the end of the trading session.VWAP = Cumulative TPV / Cumulative Volume
Interpreting the VWAP Value
The VWAP value serves as a reference point for the individual trading period. When the price is above the VWAP, it may indicate that the asset is trading at a premium compared to the day’s average.
Conversely, a price below the VWAP might suggest the asset trades at a discount. Traders often use VWAP to assess market direction and test entry and exit points for trades, utilizing it as a trend confirmation tool.
VWAP can help you discern the market trend in a given time frame. If the price is above the VWAP, it signals an uptrend; conversely, if it’s below, a downtrend is indicated. When combined with other indicators, this provides trend confirmation.
- Uptrend: Price > VWAP
- Downtrend: Price < VWAP
Price Analysis and Volume
By studying the intersection of price and volume, VWAP allows for analyzing market liquidity and price action. The indicator is sensitive to changes in both elements, thus reflecting whether a price range is backed by substantial volume traded. This can be useful for identifying whether movements are significant or merely noise.
- High Volume Price Range: Confirms the importance of price level.
- Low Volume Price Range: Suggests less significant price movements.
VWAP for Trade Entries and Exits
RWAP can act as a filter to refine entry and exit decisions. In a strong trend, your trade entries might align with pullbacks toward the VWAP, providing a higher probability scenario for following the trend. Similarly, setting stops just beyond VWAP may support risk management strategies.
- Entries: Look for pullbacks to VWAP in the direction of the trend.
- Exits: Place stops beyond VWAP to manage potential losses.
These applications of VWAP can help you understand support and resistance levels, making it a versatile tool in your trading arsenal.
Challenges and Limitations
While the VWAP (Volume Weighted Average Price) can be a powerful tool for traders, understanding its limitations and challenges is crucial for effective use. This will help you navigate potential issues and apply the indicator more effectively.
Understanding VWAP Lag
VWAP is inherently a cumulative indicator. It is calculated by adding up the dollar value of all transactions and dividing by the total volume from the start of the trading day. This characteristic results in a natural lag, as the VWAP adjusts with every new trade but always reflects past data. The lag is especially notable in highly volatile markets where price moves can be steep and swift, potentially rendering VWAP calculations less reflective of real-time market conditions.
VWAP’s Predictive Qualities and Misconceptions
VWAP is often misunderstood as a predictive indicator. However, it’s important to realize that VWAP’s predictive qualities are limited. It’s a lagging indicator, which provides a historical average price weighted by volume. Traders sometimes mistakenly interpret VWAP crossovers as signals of future price movements, but these signals should be taken cautiously. They do not necessarily indicate where prices will go, but rather where they have been in terms of volume.
Managing Risks Associated with VWAP
Utilizing the VWAP involves risk management, just like any trading strategy. A key risk arises from relying too heavily on VWAP without considering other market factors. Since VWAP is a cumulative indicator, it must recognize that it doesn’t adjust to sudden market shifts or news events that can drastically affect prices. Your reliance on VWAP should always be in conjunction with a wider set of tools and an understanding of the broader market context to mitigate these risks.
Practical VWAP Tips
To effectively utilize the Volume Weighted Average Price (VWAP) in your trading strategies, understanding its application throughout the trading day and across different market conditions is crucial. These practical tips enhance your proficiency in handling VWAP to ensure optimal trading performance.
Best Practices for Using VWAP in Trading
When incorporating VWAP into your trading, it’s essential to focus on key aspects that can help reinforce your trading decisions. Follow these best practices:
- Confirmation of Market Trend: Utilize VWAP to identify the market trend. When the price is above the VWAP, it indicates a potential upward trend, while a price below suggests a downward trend. This is particularly useful in trending markets.
- Price Entries and Exits: Consider using VWAP for optimal entry and exit points. Aim to buy below VWAP during an uptrend and sell above it when the market shows signs of reversing.
Adjusting to Different Market Conditions
Your strategy should be flexible to adapt to the percentage change and volatility of the market. Here’s how you can adjust:
- Volatile Markets: In highly volatile markets, VWAP can lag. Give precedence to the market’s direction by adjusting your time frame for analysis.
- Consolidating Markets: VWAP might provide support and resistance levels if the market is ranging. Use shorter time frames on intraday charts to detect these fluctuations.
VWAP on Intraday Charts
Intraday analysis using VWAP can guide your short-term trading decisions. Be attentive to these elements:
- Time Frame Selection: One-hour and four-hour charts might be particularly revealing for intraday trading. However, you should select the best time frame for your trading style.
- Volume Analysis: Pay attention to the volume, as it plays a significant role in VWAP calculations. Increased volume can lead to price movements toward the VWAP, indicating a stronger signal.
Definition of VWAP
VWAP, or Volume-Weighted Average Price, represents the average price a security has traded throughout the day, based on both volume and price. It determines the liquidity and efficiency of a particular market or asset.
Components of VWAP
The fundamental components of the VWAP are:
- Price: This is usually calculated using the typical price for a specific period, which is the average of the high, low, and close prices.
- Volume: The total number of shares or contracts traded during the period.
The formula for VWAP is:VWAP = Cumulative (Typical Price x Volume) / Cumulative Volume
The “typical price” for each minute is multiplied by the volume for that minute, and the result is then divided by the total volume up to that point in the day.
FAQ
What is the best software for trading VWAP?
TrendSpider is a popular software for trading VWAP. It offers a wide range of features and tools that can assist traders in analyzing and utilizing VWAP effectively. The platform allows users to customize their charts and indicators, including VWAP, according to their preferences and trading strategies.
How can I use the VWAP indicator for better trade execution?
When executing trades, the VWAP can serve as a reference point for entry and exit. If the price crosses above the VWAP, it may be considered a good time to buy, while a price crosses below the VWAP may be a selling opportunity. Using VWAP can help you determine the market direction and trade accordingly.
Which strategies are most effective when using the VWAP indicator?
You can use VWAP with other indicators like moving averages and Bollinger Bands to create effective strategies. For instance, a common strategy is to enter a trade when the price crosses above the VWAP if you're looking to ride an upward trend. Conversely, shorting a stock when it falls below the VWAP could be advantageous if a downward trend is expected.
What are the benefits of using VWAP in swing trading?
Using the VWAP can help you gauge the strength of price movements and market depth in swing trading. It provides a volume-averaged perspective, which can be revealing for identifying support and resistance levels over short to medium-term horizons.
How does the VWAP indicator differ from other volume indicators?
Unlike simple volume indicators that only tell you how much of an asset is traded, the VWAP combines both volume and price, offering a weighted average that is much more indicative of true market sentiment. It provides a more detailed view of the market compared to indicators that consider price alone.
Is the VWAP indicator suitable for all types of trading sessions?
The VWAP is most relevant and accurate during regular trading hours on a Heikin Ashi chart, as it relies on high liquidity to provide meaningful data. During extended hours, the indicator may not reflect true market conditions due to the lower volume of trades.
Appendix: Backtesting Data Tables
Daily DJ30 OHLC VWAP Test Results
| Ticker | Data Analyzed (years) | Positions | Wins | Losses | Max DD | Max DD (Asset) | Average Win | Average Loss | Average Return | Rew/Risk Ratio | Expectancy |
| AAPL | 13.9 | 222 | 41% | 59% | -25.20% | -44.30% | 5.78% | -2.14% | 1.14% | 2.7 | 0.5 |
| AMGN | 13.9 | 236 | 42% | 58% | -26.10% | -26.00% | 3.68% | -1.76% | 0.52% | 2.09 | 0.3 |
| AXP | 13.9 | 261 | 40% | 60% | -55.00% | -47.80% | 3.58% | -2.20% | 0.10% | 1.62 | 0 |
| BA | 13.9 | 255 | 38% | 62% | -47.00% | -78.00% | 5.30% | -2.39% | 0.51% | 2.22 | 0.2 |
| CAT | 13.9 | 240 | 38% | 62% | -29.30% | -50.00% | 5.02% | -2.13% | 0.58% | 2.35 | 0.3 |
| CRM | 13.9 | 249 | 39% | 61% | -46.10% | -58.60% | 5.40% | -2.61% | 0.51% | 2.07 | 0.2 |
| CSCO | 13.9 | 256 | 38% | 62% | -46.10% | -49.70% | 3.80% | -2.21% | 0.07% | 1.72 | 0 |
| CVX | 13.9 | 248 | 36% | 64% | -29.90% | -58.60% | 4.06% | -1.83% | 0.28% | 2.21 | 0.2 |
| DIS | 13.9 | 262 | 33% | 67% | -41.40% | -60.10% | 3.79% | -1.61% | 0.18% | 2.35 | 0.1 |
| DOW | 4.9 | 99 | 31% | 69% | -29.60% | -60.60% | 4.45% | -2.06% | -0.02% | 2.16 | 0 |
| GS | 13.9 | 224 | 38% | 63% | -33.40% | -52.10% | 5.40% | -2.37% | 0.55% | 2.28 | 0.2 |
| HD | 13.9 | 245 | 40% | 60% | -33.40% | -37.10% | 4.01% | -1.78% | 0.56% | 2.25 | 0.3 |
| HON | 13.9 | 261 | 39% | 61% | -29.20% | -42.20% | 3.28% | -1.68% | 0.24% | 1.95 | 0.1 |
| IBM | 13.9 | 253 | 40% | 60% | -33.30% | -56.10% | 2.93% | -1.67% | 0.15% | 1.76 | 0.1 |
| INTC | 13.9 | 263 | 34% | 66% | -61.10% | -63.20% | 4.45% | -2.14% | 0.12% | 2.08 | 0.1 |
| JNJ | 13.9 | 275 | 39% | 61% | -32.30% | -25.90% | 2.27% | -1.23% | 0.15% | 1.85 | 0.1 |
| JPM | 13.9 | 250 | 38% | 62% | -33.30% | -42.40% | 3.76% | -1.83% | 0.30% | 2.06 | 0.2 |
| KO | 13.9 | 266 | 38% | 62% | -21.40% | -36.70% | 2.09% | -1.17% | 0.07% | 1.79 | 0.1 |
| MCD | 13.9 | 243 | 40% | 60% | -22.70% | -38.60% | 2.66% | -1.24% | 0.30% | 2.14 | 0.2 |
| MMM | 13.9 | 252 | 39% | 61% | -34.20% | -66.60% | 2.71% | -1.49% | 0.14% | 1.81 | 0.1 |
| MRK | 13.9 | 249 | 38% | 62% | -29.10% | -25.50% | 3.05% | -1.56% | 0.18% | 1.95 | 0.1 |
| MSFT | 13.9 | 283 | 36% | 64% | -41.70% | -36.80% | 3.76% | -1.79% | 0.21% | 2.1 | 0.1 |
| NKE | 13.9 | 260 | 37% | 63% | -37.90% | -52.70% | 3.60% | -1.95% | 0.12% | 1.85 | 0.1 |
| PG | 13.9 | 255 | 38% | 62% | -33.70% | -27.20% | 2.43% | -1.23% | 0.16% | 1.97 | 0.1 |
| TRV | 13.9 | 278 | 37% | 63% | -30.10% | -46.50% | 3.13% | -1.37% | 0.28% | 2.29 | 0.2 |
| UNH | 13.9 | 259 | 40% | 60% | -31.40% | -35.10% | 3.46% | -1.77% | 0.32% | 1.96 | 0.2 |
| V | 13.9 | 266 | 45% | 55% | -30.30% | -34.90% | 2.79% | -1.83% | 0.24% | 1.52 | 0.1 |
| VZ | 13.9 | 248 | 34% | 66% | -31.60% | -50.20% | 3.08% | -1.22% | 0.25% | 2.53 | 0.2 |
| WBA | 9.1 | 169 | 35% | 65% | -72.90% | -79.40% | 3.00% | -2.49% | -0.57% | 1.21 | -0.2 |
| WMT | 13.9 | 262 | 39% | 61% | -34.90% | -37.10% | 2.73% | -1.38% | 0.22% | 1.97 | 0.2 |
| Summary | 403.2 | 7389 | 38% | 62% | -36% | -47% | 4% | -2% | 0% | 2.03 | 0.15 |
Daily DJ30 Heikin Ashi VWAP Test Results
| Market | Data Analyzed (years) | Positions | Wins | Losses | Max DD | Max DD (Asset) | Average Win | Average Loss | Average Return | Rew/Risk Ratio | Expectancy |
| AAPL | 13.9 | 190 | 50% | 50% | -17.20% | -43.50% | 6.24% | -1.62% | 2.31% | 3.85 | 1.4 |
| AMGN | 13.9 | 194 | 48% | 52% | -12.60% | -25.30% | 4.45% | -1.29% | 1.49% | 3.45 | 1.2 |
| AXP | 13.9 | 210 | 48% | 52% | -25.30% | -46.00% | 4.11% | -1.61% | 1.14% | 2.55 | 0.7 |
| BA | 13.9 | 202 | 45% | 55% | -28.50% | -76.60% | 6.06% | -1.69% | 1.76% | 3.58 | 1 |
| CAT | 13.9 | 196 | 47% | 53% | -16.40% | -49.40% | 5.63% | -1.69% | 1.75% | 3.34 | 1 |
| CRM | 13.9 | 196 | 46% | 54% | -25.50% | -58.40% | 6.45% | -2.16% | 1.80% | 2.99 | 0.8 |
| CSCO | 13.9 | 208 | 49% | 51% | -22.10% | -48.90% | 3.92% | -1.83% | 0.96% | 2.14 | 0.5 |
| CVX | 13.9 | 213 | 44% | 56% | -17.70% | -57.10% | 4.36% | -1.26% | 1.19% | 3.45 | 0.9 |
| DIS | 13.9 | 208 | 45% | 55% | -27.30% | -59.50% | 3.84% | -1.32% | 1.01% | 2.92 | 0.8 |
| DOW | 4.9 | 80 | 46% | 54% | -20.30% | -57.60% | 4.32% | -1.46% | 1.21% | 2.96 | 0.8 |
| GS | 13.9 | 198 | 41% | 59% | -22.00% | -51.20% | 6.16% | -1.67% | 1.57% | 3.68 | 0.9 |
| HD | 13.9 | 200 | 48% | 53% | -19.50% | -36.10% | 4.68% | -1.32% | 1.53% | 3.53 | 1.2 |
| HON | 13.9 | 217 | 44% | 56% | -15.10% | -38.90% | 3.93% | -1.34% | 0.99% | 2.94 | 0.7 |
| IBM | 13.9 | 206 | 47% | 53% | -17.40% | -55.10% | 3.32% | -1.38% | 0.83% | 2.41 | 0.6 |
| INTC | 13.9 | 205 | 48% | 52% | -29.00% | -62.70% | 4.49% | -1.71% | 1.28% | 2.63 | 0.8 |
| JNJ | 13.9 | 213 | 48% | 52% | -15.30% | -22.70% | 2.66% | -0.96% | 0.78% | 2.78 | 0.8 |
| JPM | 13.9 | 214 | 48% | 52% | -17.00% | -40.90% | 4.23% | -1.48% | 1.24% | 2.86 | 0.8 |
| KO | 13.9 | 221 | 48% | 52% | -10.20% | -33.80% | 2.30% | -0.92% | 0.64% | 2.5 | 0.7 |
| MCD | 13.9 | 201 | 45% | 55% | -12.00% | -35.10% | 3.33% | -0.99% | 0.97% | 3.37 | 1 |
| MMM | 13.9 | 203 | 43% | 57% | -15.20% | -66.10% | 3.53% | -1.14% | 0.89% | 3.1 | 0.8 |
| MRK | 13.9 | 208 | 42% | 58% | -13.60% | -24.90% | 3.62% | -1.17% | 0.86% | 3.09 | 0.7 |
| MSFT | 13.9 | 219 | 47% | 53% | -20.50% | -36.10% | 4.31% | -1.43% | 1.25% | 3.03 | 0.9 |
| NKE | 13.9 | 202 | 42% | 58% | -21.50% | -50.30% | 4.87% | -1.40% | 1.21% | 3.47 | 0.9 |
| PG | 13.9 | 204 | 49% | 51% | -13.80% | -27.00% | 2.67% | -1.03% | 0.77% | 2.61 | 0.8 |
| TRV | 13.9 | 220 | 38% | 62% | -17.80% | -44.70% | 4.13% | -1.02% | 0.95% | 4.06 | 0.9 |
| UNH | 13.9 | 213 | 50% | 50% | -18.20% | -31.80% | 3.96% | -1.45% | 1.23% | 2.73 | 0.8 |
| V | 13.9 | 220 | 51% | 49% | -17.00% | -32.00% | 3.47% | -1.45% | 1.05% | 2.39 | 0.7 |
| VZ | 13.9 | 197 | 39% | 61% | -14.20% | -49.70% | 3.82% | -0.98% | 0.89% | 3.89 | 0.9 |
| WBA | 9.1 | 133 | 40% | 60% | -30.10% | -79.30% | 3.76% | -1.83% | 0.39% | 2.05 | 0.2 |
| WMT | 13.9 | 201 | 48% | 52% | -20.90% | -36.40% | 3.10% | -1.17% | 0.87% | 2.65 | 0.7 |
| Summary | 403.2 | 5992 | 46% | 54% | -19% | -46% | 4% | -1% | 1% | 3.03 | 0.83 |