The Commodity Channel Index (CCI) measures price deviation from its statistical mean. It comprises two components: a zero line and an unbounded oscillator that moves above and below it. When CCI exceeds 100, it is considered overbought, and less than -100 is oversold.
I tested the reliability of the CCI across all DJ30 and S&P 500 stocks, utilizing 10,600 years of exchange data. Having withstood my rigorous testing, I confirm that CCI provides reliable buy and sell signals.
Based on 43,297 test trades, my research indicates that the CCI is a highly profitable momentum indicator, yielding a win rate of up to 85% when used with the correct settings.
However, optimal settings and understanding how to trade CCI are crucial for success.
Key Takeaways
- Beginner traders do not commonly use the CCI, but it can be highly profitable in the right circumstances.
- Based on my testing, the Commodity Channel Index can be highly profitable, with a win rate of up to 85%.
- Selecting the right timeframe and settings for the Commodity Channel Index is important.
What is the Commodity Channel Index (CCI)?
The Commodity Channel Index (CCI) is a momentum indicator that traders use to identify overbought and oversold conditions. This tool was developed to identify cyclical turns in commodities. It has since been adapted to measure the strength of trends and volatility across various assets, including stocks and indices.
What Does It Measure?
The Commodity Channel Index measures the deviation of a commodity’s price from its statistical mean. It comprises a zero line and an unbounded oscillator, which moves above and below zero. As the oscillator rises or falls, the indicator’s value also changes. When it reaches certain levels, it is considered overbought or oversold.
Commodity Channel Index is one of the lesser-used indicators and is mostly unknown by beginner traders, but is it a hidden gem that is incredibly profitable?
How does it work?
The logic behind the CCI indicator is relatively straightforward. The indicator compares the distance of the price from its statistical mean, calculated using a moving average. By analyzing the price deviation based on past data, traders can better identify potential changes in price direction.
The CCI oscillator can move above and below the zero line, which serves as a reference point for overbought and oversold conditions. Values above +100 indicate an overbought condition, while values below -100 indicate an oversold condition. If the indicator moves away from these thresholds, the price will likely reverse or pause before continuing its trend.
How to Trade CCI
Much is written about the best way to trade the Commodity Channel Index, but my testing shows only one profitable strategy. The proven way to trade the CCI indicator is to buy when it moves above -100 after dipping below it and sell when it moves back below +100 after rising above it.
It’s essential to note that the CCI can also generate false signals up to 50% of the time, particularly with incorrect settings. Based on my considerable data, I will detail the optimal settings.
Some so-called trading gurus suggest selling when the indicator moves above the 100 line (indicating overbought conditions) and buying when the indicator is below the -100 line (indicating oversold conditions). This advice is a recipe for disaster. This strategy of selling overbought and buying oversold is incredibly unprofitable because it does not consider that a stock can remain overbought or oversold for an extended period, and that is where the big profits are made.
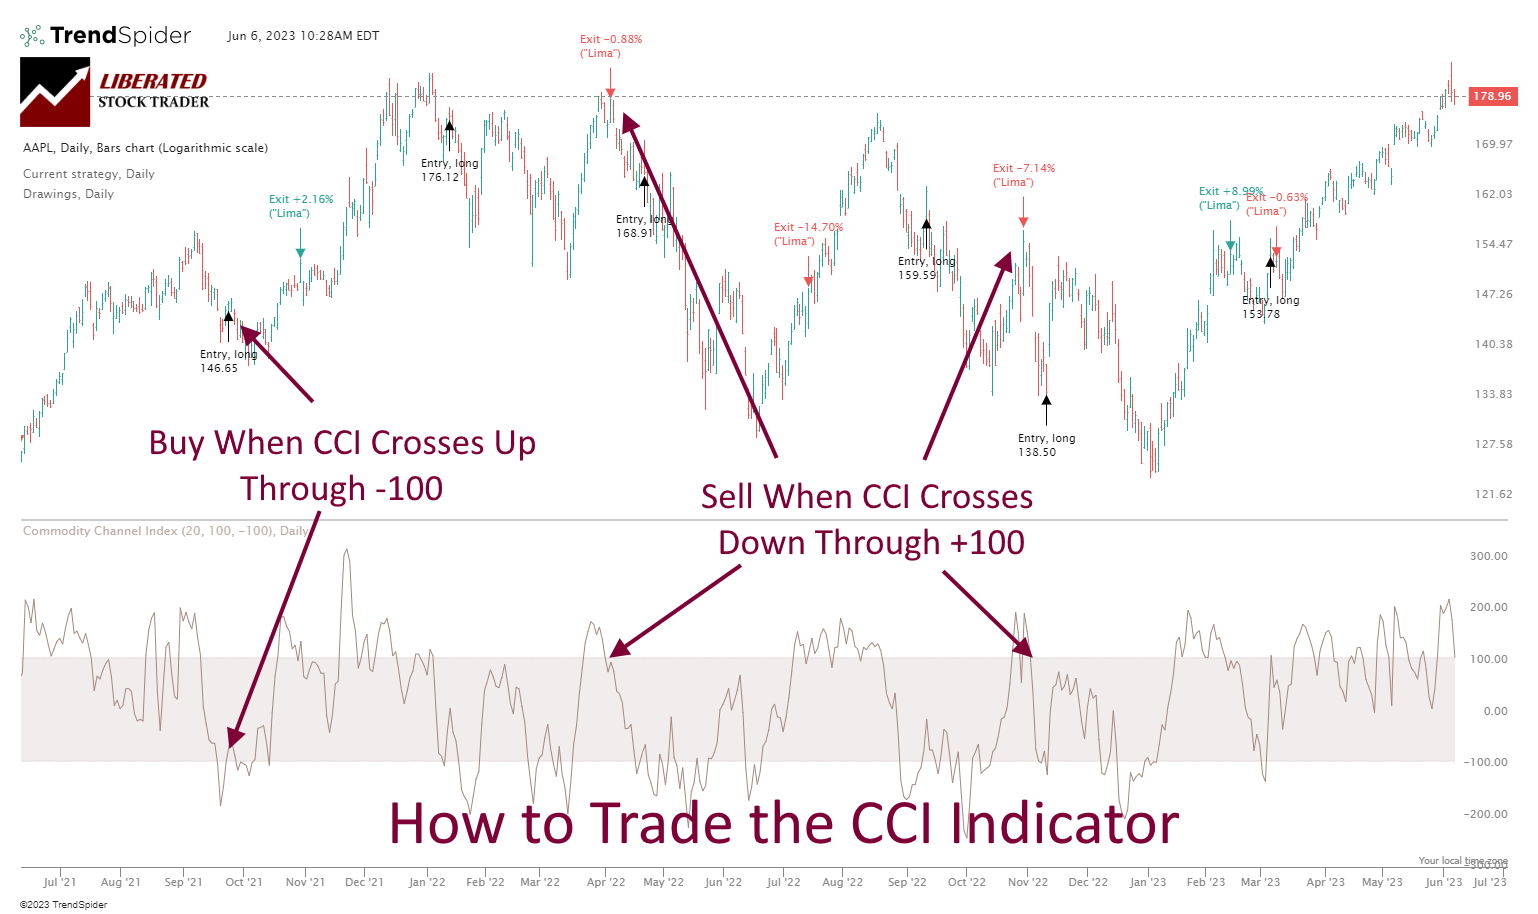
Chart Produced with TrendSpider
Pros & Cons
The CCI determines when a trend may be reversing and can detect when prices are overbought or oversold. It responds quickly to daily price changes, making it an ideal indicator for medium-term trading strategies. The formula’s sound analytical basis also adds credibility to its use.
The main drawback to using the Commodity Channel Index is that it can be prone to false signals due to its unbounded nature. Additionally, it may not pick up many major trends as it lags behind price movements.
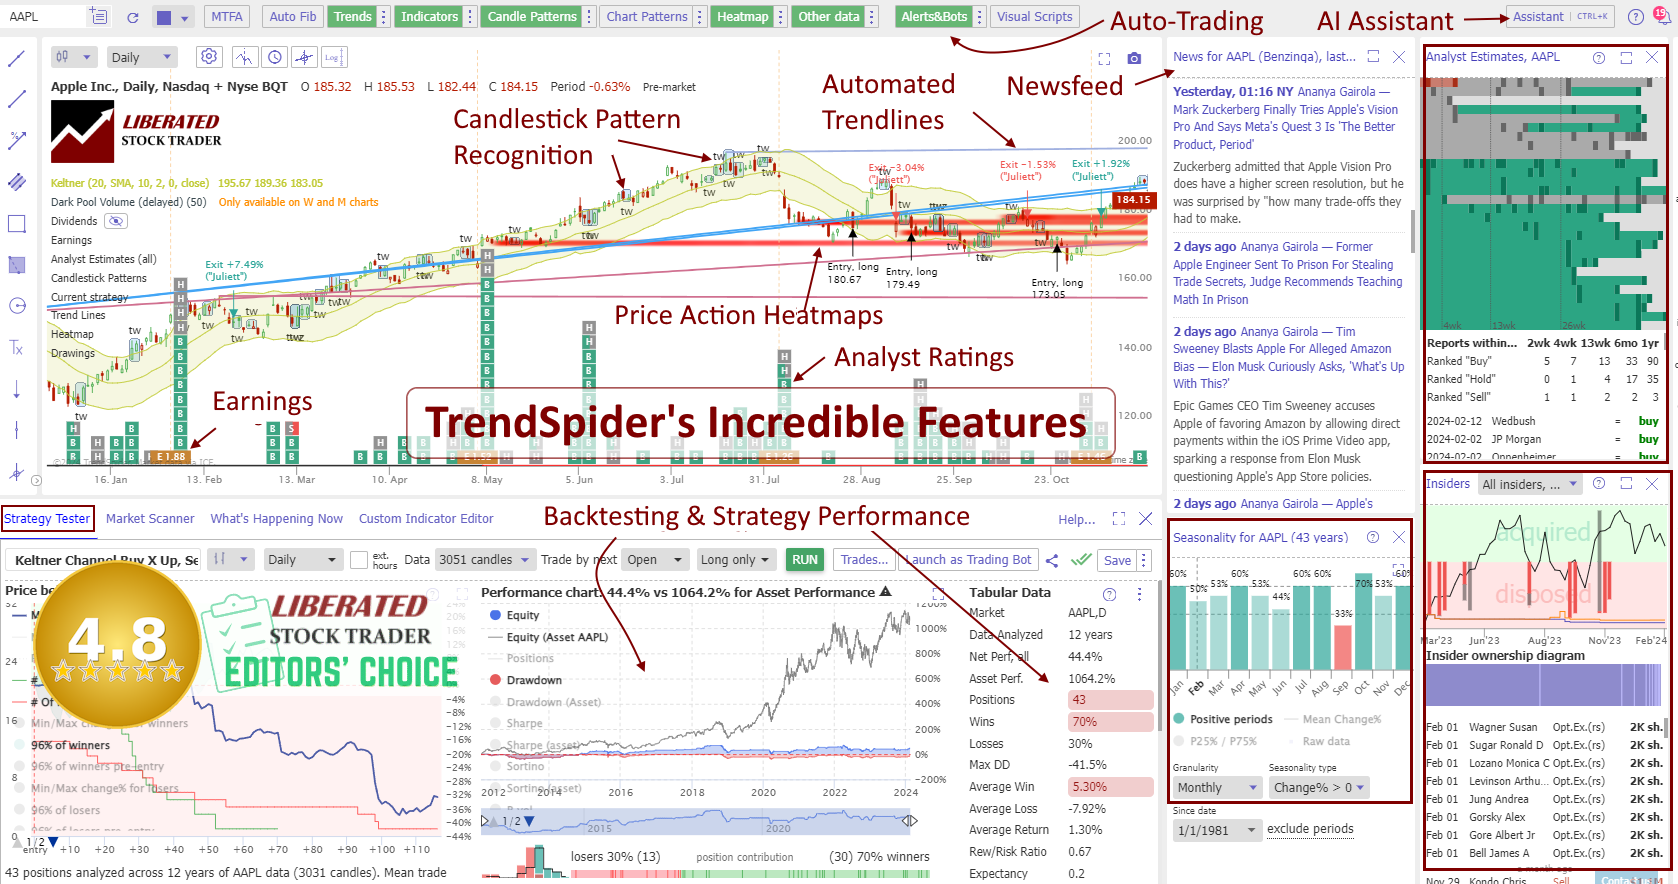
TrendSpider 4.8/5⭐: My Pick for AI-Power & Auto-Trading
I’ve used TrendSpider for 7 years for my research and testing. It auto-detects trendlines, patterns, and candlesticks, backtests ideas, and lets you use AI to create unique strategies and launch trading bots—with no code.
☆ 45% Discounts on Advanced, Elite & Premium Plans ☆
Unleash Pure AI, Auto-Trading & Industry Leading Trade Automation
Deal Ends In:
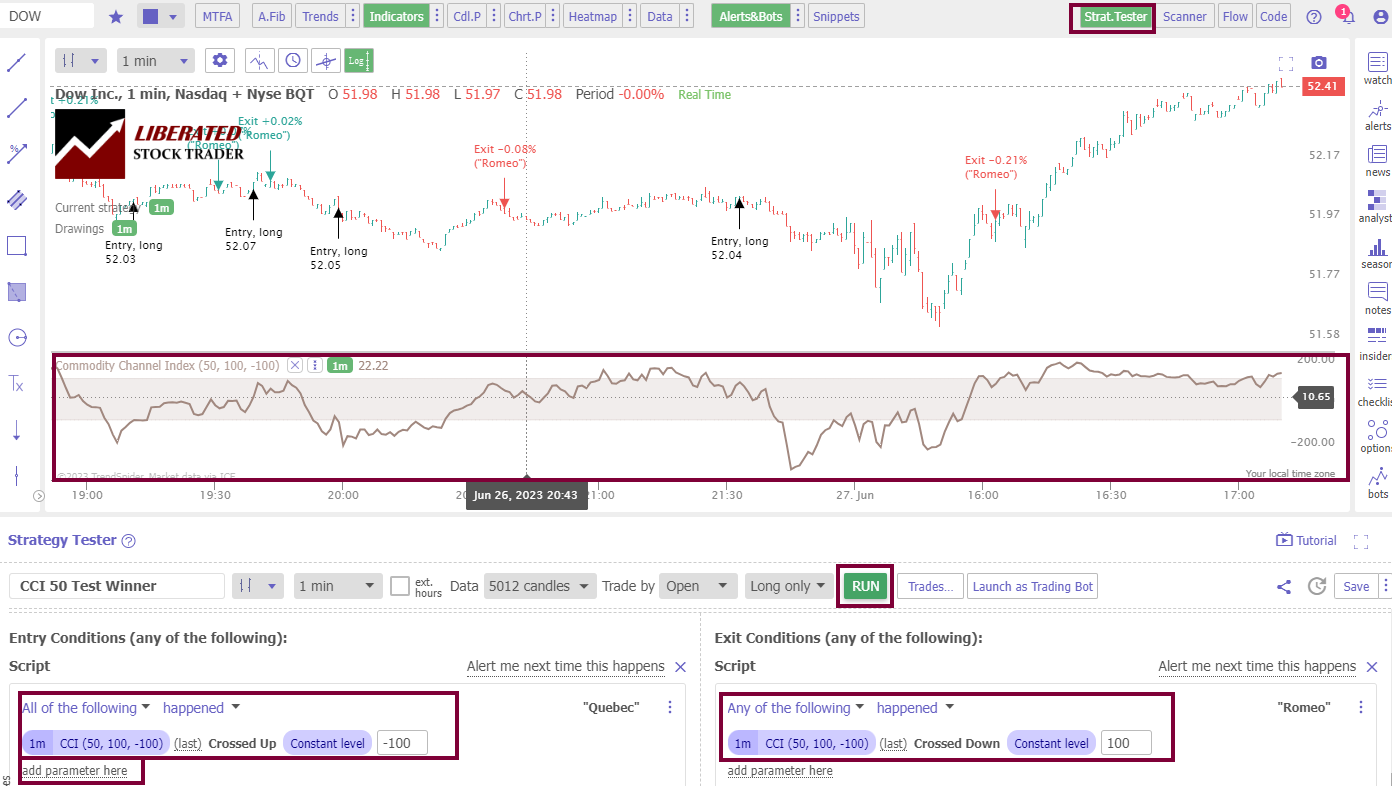
How I Backtested CCI
To set up Commodity Channel Index backtesting in TrendSpider, follow these steps:
- Register for TrendSpider.
- Select Strategy Tester > Entry Condition > Add Script > Add Parameter > Condition > Indicator > CCI (50,100,-100) > Crossed Up Through Constant Level -100.
- For the Sell Criteria, select > Add Script > Add Parameter > Condition > Indicator > CCI (50,100,-100) > Crossed Down Through Constant Level 100.
- Finally, click “RUN.”
Backtest Your Strategies on TrendSpider Now
Do you want to test any indicator, chart pattern, or performance for any US stock? The award-winning TrendSpider software makes it easy! My Trendspider review unveils insights into discovering the most powerful trading strategy development and testing service.
CCI Indicator Backtesting Results
I tested the standard configuration of the CCI indicator (20,100,-100) on the Dow Jones Industrial Average stocks on four timeframes: 1-minute, 5-minute, 1-hour, and daily charts, and the results were very poor. On a 1-minute chart, the Commodity Channel Index produced a 50% success rate, which is very high for a 60-second chart. On all other timeframes, the standard setting was unprofitable.
| CCI Setting | OHLC Chart | Index | Duration | % Winners | Avg # Trades |
| 20 | 1-min | DJ30 | 20 Days | 50% | 98 |
| 20 | 5-min | DJ30 | 2 Months | 13% | 64 |
| 30 | 5-min | DJ30 | 3 Months | 10% | 42 |
| 50 | 1-hour | DJ30 | 2 Years | 47% | 63 |
| 50 | Daily | DJ30 | 10 Years | 50% | 22 |
| 50 | Daily | S&P 500 | 20 Years | 53% | 21 |
The best results were achieved using the CCI with a 50 setting on daily charts, which produced a 50% win rate on the Dow Jones 30 stocks and a 53% success rate on the S&P 500.
This means that 53% of stocks beat a buy-and-hold strategy. However, more importantly, the strategy significantly outperformed the S&P 500 over 20 years, as the profits from the winning trades outweighed the losses from the losing trades.
The Best CCI Indicator Settings
My 396 years of TrendSpider backtests revealed conclusively that the best setting for the Commodity Channel Index is using CCI-20 on a 1-minute chart, producing a 50% win rate. Additionally, using a CCI-50 setting on a daily chart over 20 years produced a 553% increase in profit versus a buy-and-hold strategy on the S&P 500. These settings are incredibly successful.
Next, I will show a selection of those successful trades.
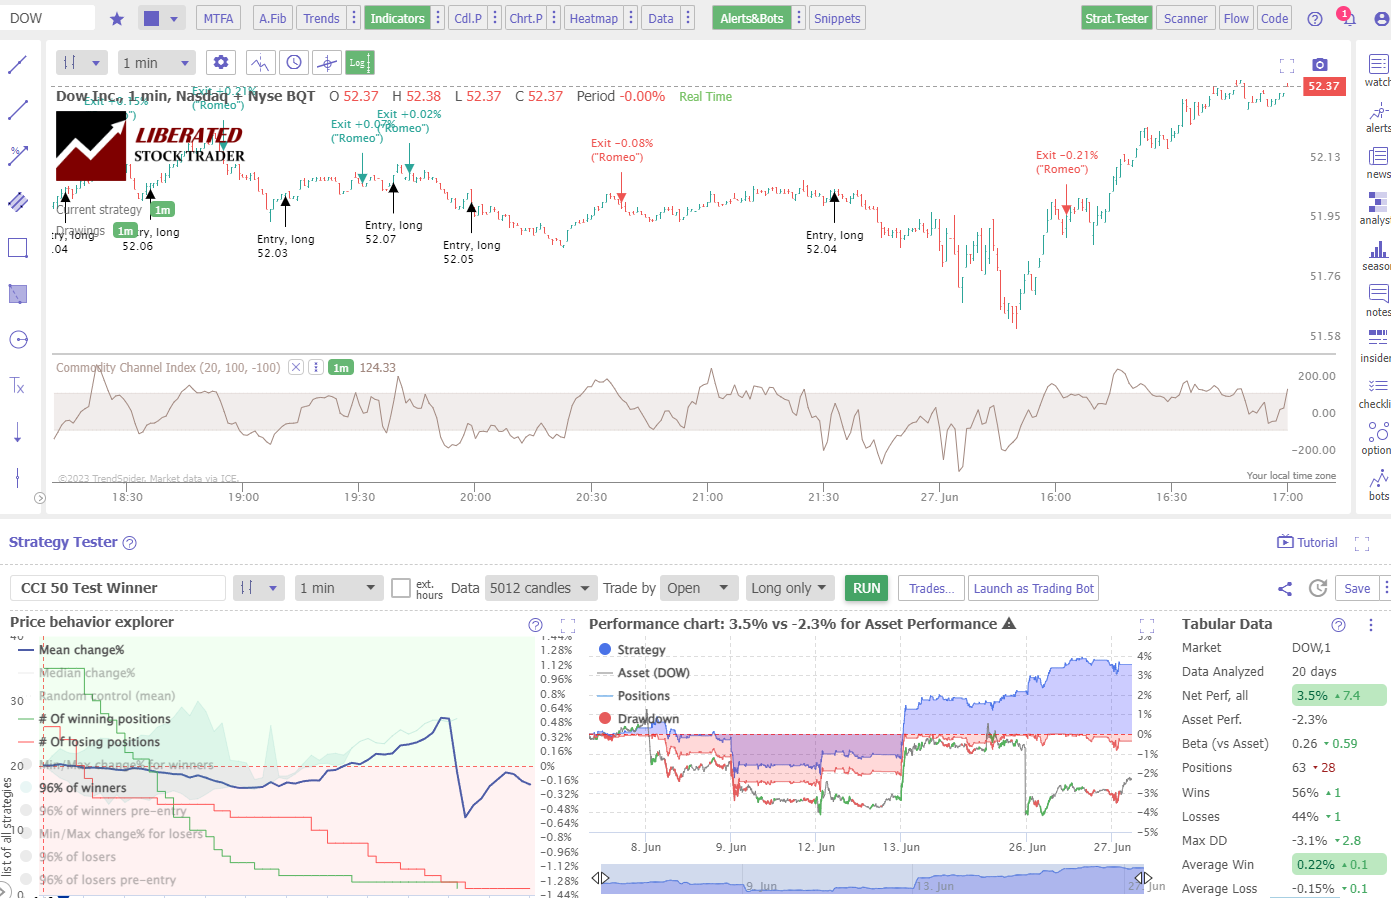
CCI Performance Test: 1-Minute Day Trading Chart
My testing of Dow Inc. (Ticker: Dow) on a 1-minute chart over 20 days shows a Commodity Channel Index-20 strategy returning a profit of +3.5% versus the buy-and-hold return of -2.3%. There were 63 trades with an average win of 0.22% versus a loss of -0.15%. However, 56% of trades were winners.
A profitable indicator on a 1-minute chart is rare, which makes the CCI indicator profitable and very useful for day traders.
Backtest Powerful Strategies on TrendSpider Now
CCI Performance Test: Daily Chart
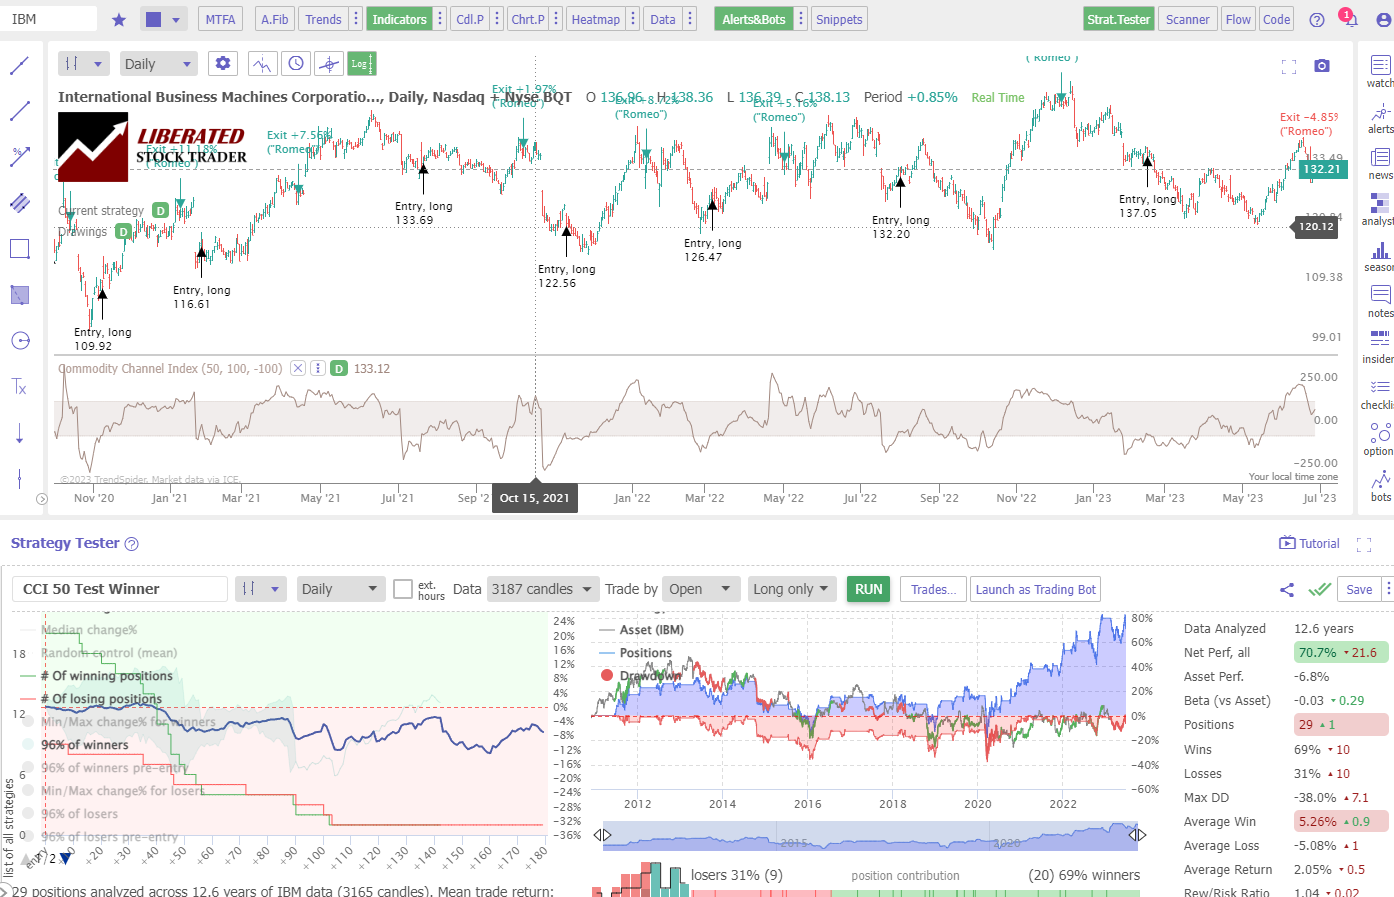
My testing of IBM Corp. (Ticker: IBM) over 12 years shows the Commodity Channel Index strategy returned a profit of +70.7% versus a buy-and-hold return of -6.8%. This is a vastly superior return, with 29 trades. The average trade return was 5.26%, versus an average loss of -5.08%. The big difference here was that 69% of trades were winners.
This highlights the power of using tailored Commodity Channel Index strategies for long-term investments and short-term trades. Furthermore, this is just one example of the strategies available to traders with the right tools.
Get Point & Click Backtesting on TrendSpider
20-Year CCI Indicator S&P 500 Performance Results
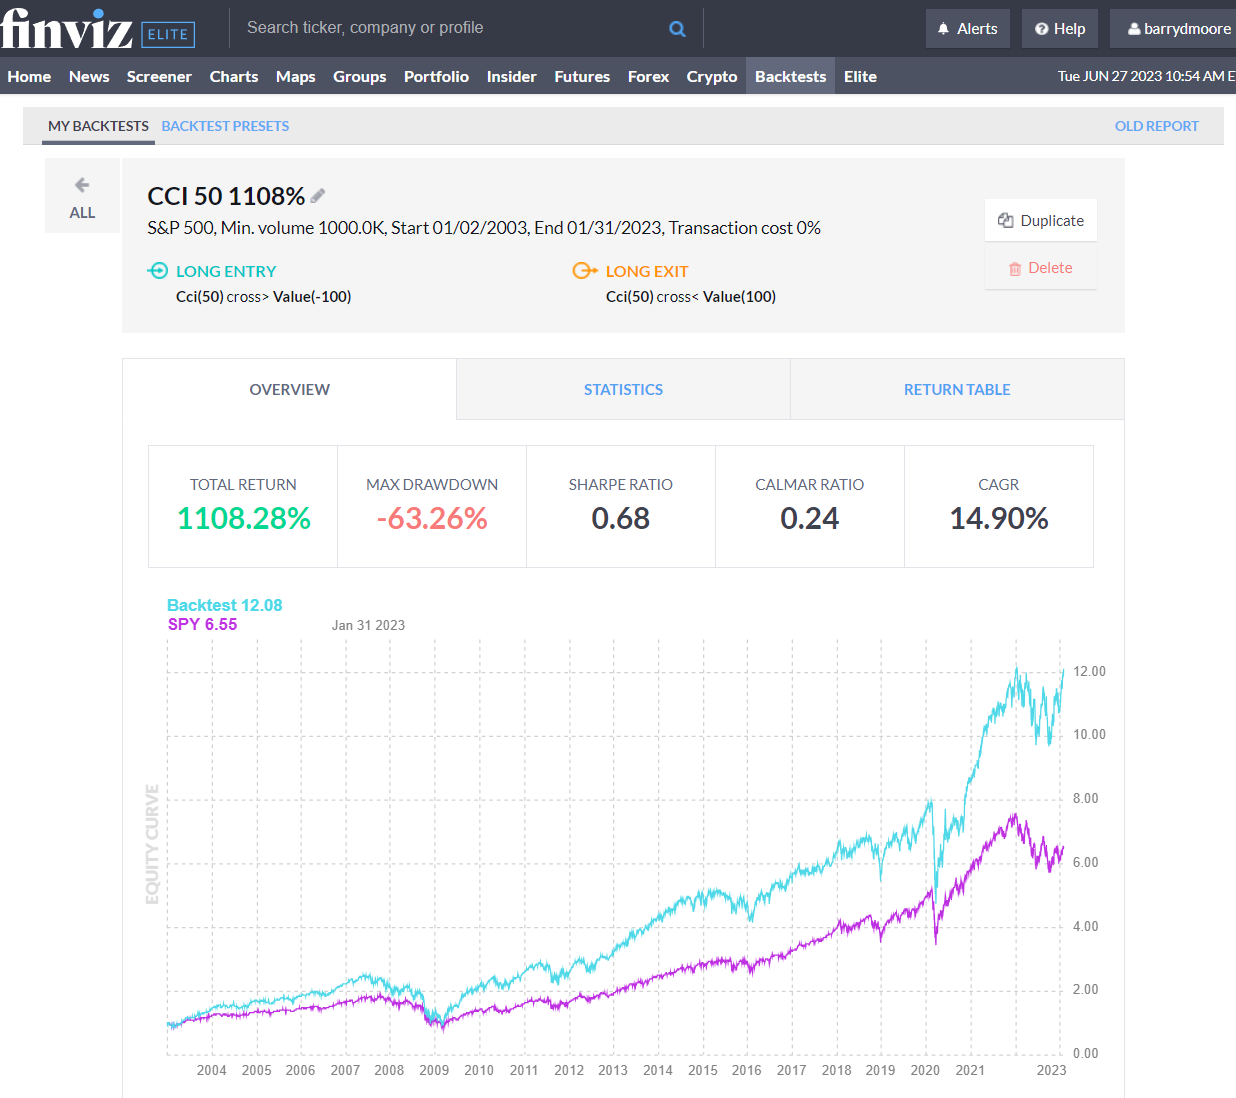
My test data shows that using the CCI indicator with a 50 setting on the S&P 500 index stocks over 20 years was incredibly profitable, returning a 1,108% profit compared to the market, which returned 555%. This is double the return of a buy-and-hold strategy, making the CCI-50 one of the best indicators I tested.
Here are the results.
Get FinViz Elite Backtesting & Screening
To test the Commodity Channel Index on the 500 largest US stocks in the S&P 500, I used the excellent backtesting solution provided by FinViz Elite. Finviz’s point-and-click backtesting engine allowed me to test the Commodity Channel Index-50 on a daily chart over the previous 20 years.
20-Year CCI Indicator Reliability Statistics
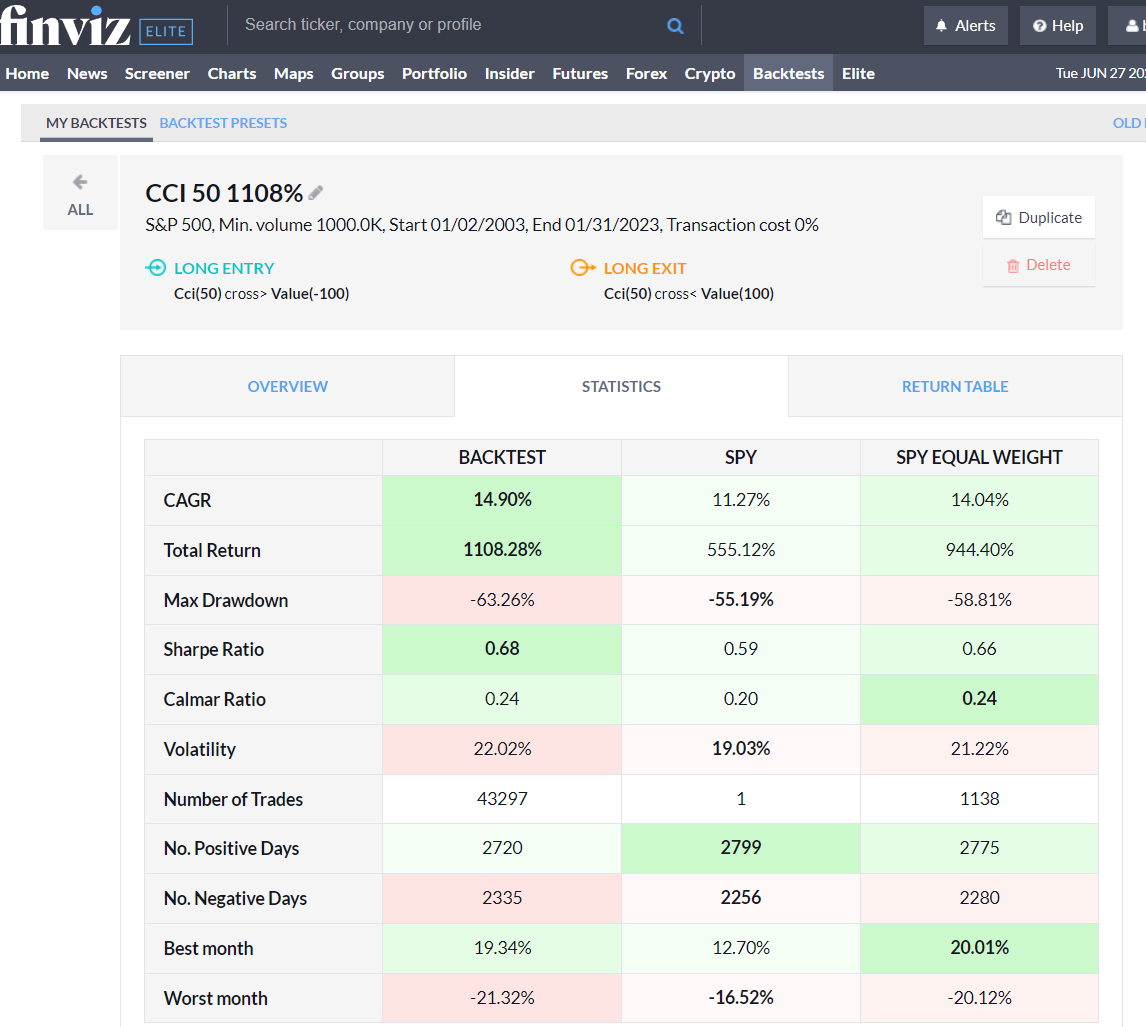
With a 50 setting, the Commodity Channel Index outperformed the S&P 500 stocks over 20 years. It made a total return of 1,108% versus a buy-and-hold strategy profit of 555%. There were 43,297 trades, and 53% of trading days were winners.
Over 20 years, the Commodity Channel Index (CCI) yielded double the profits compared to a buy-and-hold strategy. Based on my tests, it is one of the best indicators available today.
Get FinViz Elite Backtesting & Screening
How to Backtest CCI Using FinViz Elite.
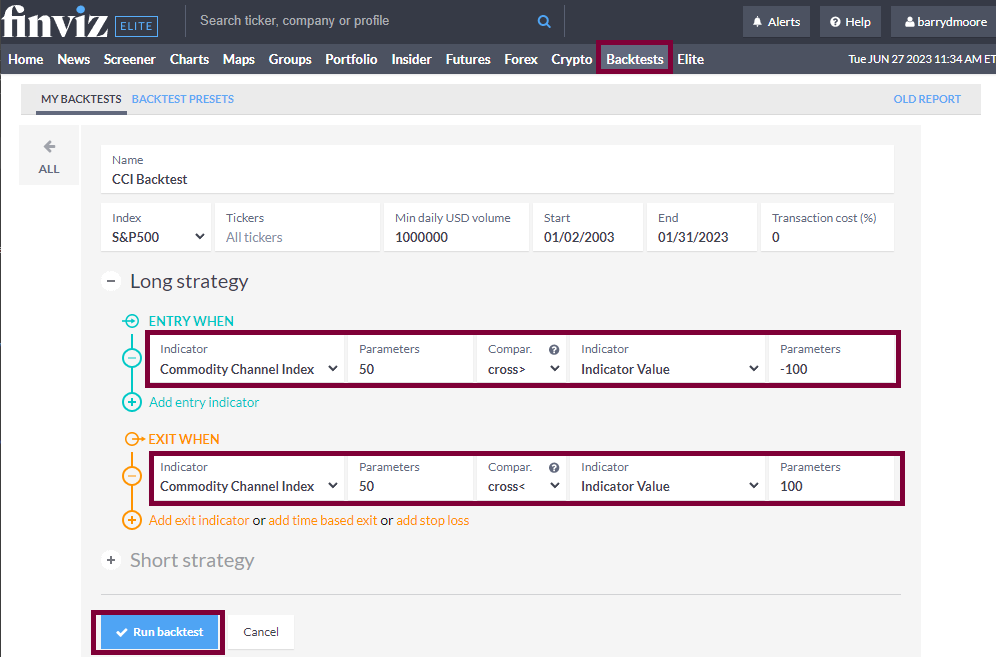
To set up Commodity Channel Index backtesting in FinViz, follow these steps:
- Register for FINVIZ.
- Select Backtests > Index=S&P500 > Entry When > Indicator > Commodity Channel Index (50) Cross Greater Than -100.
- For the Sell Criteria, select Entry When > Indicator > Commodity Channel Index (50) Cross Less Than 100.
- Finally, click “Run Backtest.”
Combining CCI with Other Indicators
The Commodity Channel Index can be combined with other technical indicators to form a more profitable trading strategy. For example, combining CCI with the Money Flow Index, Price Rate of Change, or bullish chart patterns could yield higher profits.
To test whether combining the Commodity Channel Index with other indicators is profitable, I suggest using TrendSpider, my recommended stock research and AI-powered trading software.
Can the CCI be used for Buy and Sell Signals?
Yes, the Commodity Channel Index is good for buying and selling signals. My 10,600 years of data across the DJIA and S&P500 suggest the standard Commodity Channel Index setting of 50 on a daily chart generates a market-beating 1,180% profit versus an index investing return of 550% over the last 20 years.
Should You Use the CCI?
Yes, my testing shows using CCR is an incredibly reliable indicator, with excellent returns that outperformed the market during my 20-year testing period. CCI-50 outperformed the S&P 500 by 580% over the previous two decades.
Is the CCI Indicator Accurate?
Yes, on 1-minute and daily charts, the Commodity Channel Index is 50-53% accurate, producing many more profitable trades than other indicators. CCI could be the core indicator for your trading as it beats a buy-and-hold strategy. Over 20 years of testing, it produced a return of 1180% versus a buy-and-hold strategy profit of 555%.
Is the Commodity Channel Index Reliable?
Yes, the Commodity Channel Index is one of the most reliable and accurate technical analysis indicators. Based on my thorough backtesting of the S&P 500 stocks across 20 years, CCI outperformed the market by 580%.
Calculation
Calculating the CCI is simple using the following steps.
- Calculate the typical price for each period, which is the average of the high, low, and close prices.
- Take a 20-period moving average of those typical prices. This will be referred to as the “mean” throughout this explanation.
- Subtract the mean from each typical price value to find an absolute deviation sum for each period.
- After calculating all absolute deviation sums for each period, take an average of those values compared with the previous mean.
- Finally, divide that number by 0.015 to get a final CCI value for that period. By plotting and analyzing these values on a chart, you can easily identify any buy or sell signals generated by the CCI indicator.
The Commodity Channel Index is automatically calculated using my recommended charting software, TrendSpider. But if you want to calculate CCI yourself, read on.
Formula
The Commodity Channel Index (CCI) is calculated using the formula:
CCI = (Typical Price – Average of Typical Prices)/(0.015 x Mean Deviation)
Where:
- Typical Price = (High + Low + Close)/3
- Average of Typical Prices = The average of all typical prices from a lookback period
- Mean Deviation = The average of all the differences between typical prices and their moving averages from a lookback period.
The Commodity Channel Index is an unbounded oscillator, meaning its extreme highs and lows can fluctuate wildly. A value above 100 is considered overbought, and a value below -100 is considered oversold.
Summary
After testing 10,600 years of data and over 43,000 traders, I confirm that CCI is a winning trading strategy. Use this indicator on daily and 1-minute charts to enhance your trading profitability.
I have researched and tested many technical analysis indicators, and many, such as the parabolic SAR and moving averages, have underperformed. However, the Commodity Channel Index has proven to be a winning strategy.
I have shown that the Commodity Channel Index is a proven, successful tool for traders looking to enhance their trading strategies. Its accuracy and ability to produce strong signals can make it a valuable addition to any investor’s toolkit. However, traders should not rely solely on the Commodity Channel Index; instead, they should combine it with additional indicators and conduct their testing using TrendSpider or FINVIZ Elite.
FAQ
Is the Commodity Channel Index good for trading?
Yes, our research shows that CCI is a good indicator on 1-minute and daily charts. MFI produced an excellent 53% average success rate versus a long-term buy-and-hold strategy. Our 20-year test of the S&P500 stocks proved CCI outperformed the market by 580%.
What is the best setting for Commodity Channel Index?
Our testing shows that the best setting for Commodity Channel Index is 20 on a 1-minute candlestick which yielded a 50% win rate. CCI 50 on a daily chart was the best configuration yielding 580% versus the S&P 500 over the last 20 years. Avoid CCI 20 on a 5-minute chart, as this has only a 13% win rate.
What indicators are better than Commodity Channel Index?
There are very few technical analysis indicators better than the Commodity Channel Index. Money Flow Index is a very profitable indicator, also Heikin Ashi charts, combined with the rate of change, RSI, and bullish chart patterns. Our testing has proven these indicators to be equally effective, work on many timeframes, and are successful in trading strategies.
Is the Commodity Channel Index the best indicator?
Yes, the Commodity Channel Index is one of the best indicators for trading. However, it can be improved in combination with other technical analysis indicators, such as Heikin Ashi, RSI, and bullish chart patterns like the Double Bottom, which can increase success rates up to 88 percent.
What is the best timeframe for Commodity Channel Index?
The best timeframe for Money Flow Index is a 50 setting on a daily chart, which produced a 1,108 percent gain over 26 years versus the S&P 500, according to TrendSpider. Using CCI-20 on a 1-minute chart also produced a 50% success rate.
How reliable is Commodity Channel Index?
The CCI is a reliable indicator with high success rates. Our data proves the CCI outperformed the S&P500 over 20 years with an 1108% total return versus the SPY return of 555%.
What is the best software for back-testing Commodity Channel Index?
Our in-depth Commodity Channel Index trading analysis relied on TrendSpider - the industry-leading trading tool for backtesting and strategy development. Its power and simplicity impressed me, making our research more efficient and successful.
Which is better, Commodity Channel Index or RSI?
Our 20 years of backtesting show that RSI is better than Commodity Channel Index, with an RSI return of 1282 percent, vs. CCI of 1108 percent. Both CCI and RSI are excellent indicators. I recommend testing them together using TrendSpider.
How to read the Commodity Channel Index chart?
To read the Commodity Channel Index, look for the line crossing down through the 100 line for a sell signal and crossing up through -100 for a buy signal. We tested this setting, and it works very well.
What is the best software for Commodity Channel Index trading?
TrendSpider is by far the top software for trading and backtesting Commodity Channel Index; with point-and-click backtesting requiring no coding, it's a game-changer! TradingView is also good, offing pine code backtesting and global stock exchange, crypto, and forex coverage.
Is the Commodity Channel Index the same as a moving average?
No, the Commodity Channel Index is different from a moving average. There are four main moving averages; simple, exponential, weighted, and Hull. The Commodity Channel Index is an oscillating indicator with a different calculation and significantly better performance.
Does the Commodity Channel Index work?
Yes, the Commodity Channel Index works very well using setting 50 on daily charts, which is optimal. This setup is tested to have a 53% success rate on DJ30 stocks and a 580% outperformance on S&P 500 stocks.
How accurate is Commodity Channel Index?
The Commodity Channel Index is very accurate, especially with a standard candlestick chart. Our research indicates that Commodity Channel Index has a 53 percent win rate, which is better than Parabolic SAR and Exponential Moving Averages.
How to make money trading the Commodity Channel Index?
Making money using the Commodity Channel Index is possible. The best way to succeed is to use a CCI-50 on a daily chart for higher reliability. Additionally, CCI-20 on a 1-minute chart works well.
Is the Commodity Channel Index effective for day trading?
Yes, the Money Flow Index is effective for day trading, but only on 1-minute darts. Our test results on 1-minute charts show a success rate of 50 percent. You can develop and test your original day trading CCI strategy by backtesting with TrendSpider.